
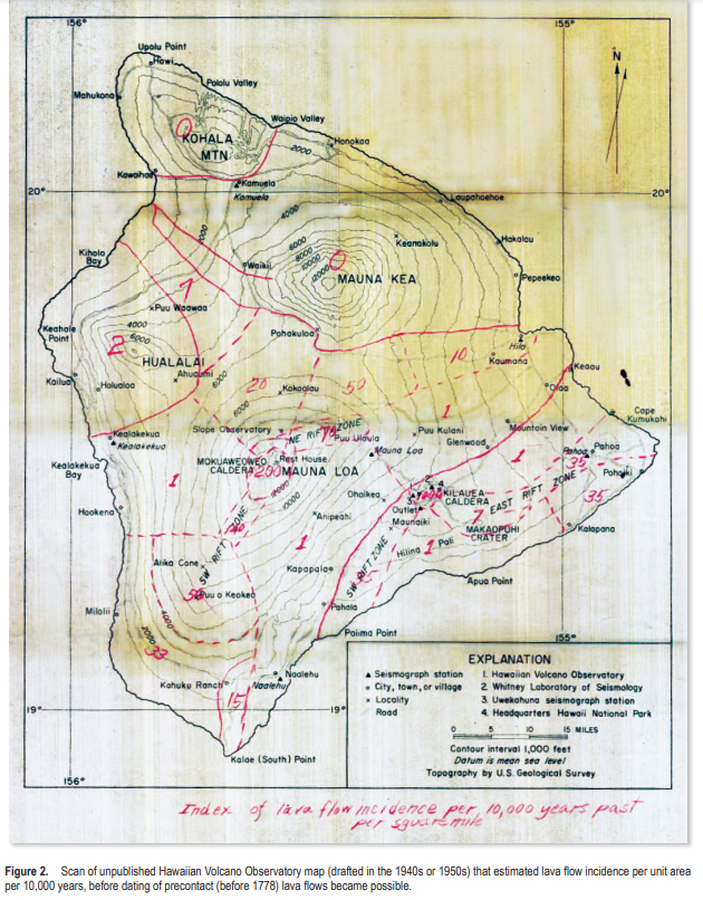
Index of lava flow incidence per 10,000 years past per square mile
Hawai‘i (regional), United States, 1940
Figure 2 (in reprint) in: Hawaiian Volcano Observatory. (1940s or 1950s). Index of lava flow incidence per 10,000 years past per square mile. (Reprinted in: Kauahikaua, J.P. & Tilling, R.I. (2014). Natural hazards and risk reduction in Hawai‘i. In: Poland, M.P., Takahashi, T.J., & Landowski, C.M. (eds.) Characteristics of Hawaiian Volcanoes. US Geological Survey Professional Paper 1801, p. 397-427. https://doi.org/10.3133/pp180110)
This map was produced by an official agency, but is NOT the most recent, most complete, or main operational map.
For the current operational hazard map, please consult the proper institutional authorities.
Click on image for full-size map. If link seems broken, try the archived version.
Kauahikaua, J.P. & Tilling, R.I. (2014). Natural hazards and risk reduction in Hawai‘i. In: Poland, M.P., Takahashi, T.J., & Landowski, C.M. (eds.) Characteristics of Hawaiian Volcanoes. US Geological Survey Professional Paper 1801, p. 397-427. https://doi.org/10.3133/pp180110Map Set
https://doi.org/10.3133/pp180110
Other Maps In Set: