
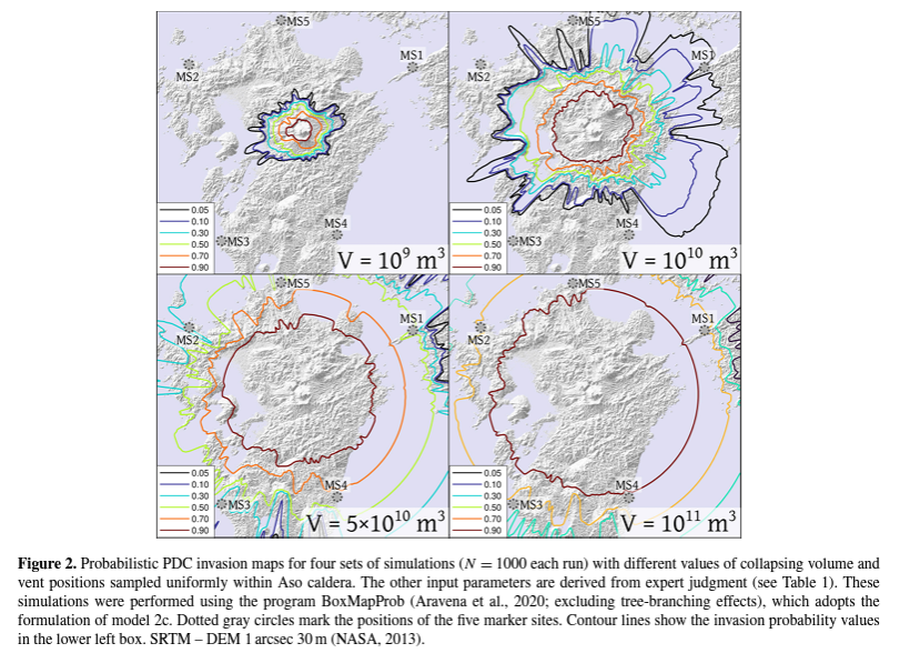
Probabilistic PDC invasion maps for four sets of simulations (N = 1000 each run) with different values of collapsing volume and vent positions sampled uniformly within Aso caldera
Asosan, Japan, 2022
Figure 2 in: Bevilacqua, A., Aravena, A., Aspinall, W., Costa, A., Mahony, S., Neri, A., Sparks, S. & Hill, B. (2022). Assessing minimum pyroclastic density current mass to impact critical infrastructures: example from Aso caldera (Japan). Natural Hazards and Earth System Sciences, 22(10), 3329-3348.
This hazard map is the result of scientific research and was published in academic literature.
It is presented here to serve as an example of the map type or the map-making methodology. It is NOT the official, operational map. For the current operational hazard map, please consult the proper institutional authorities.
Click on image for full-size map.