
← Back to Search Results

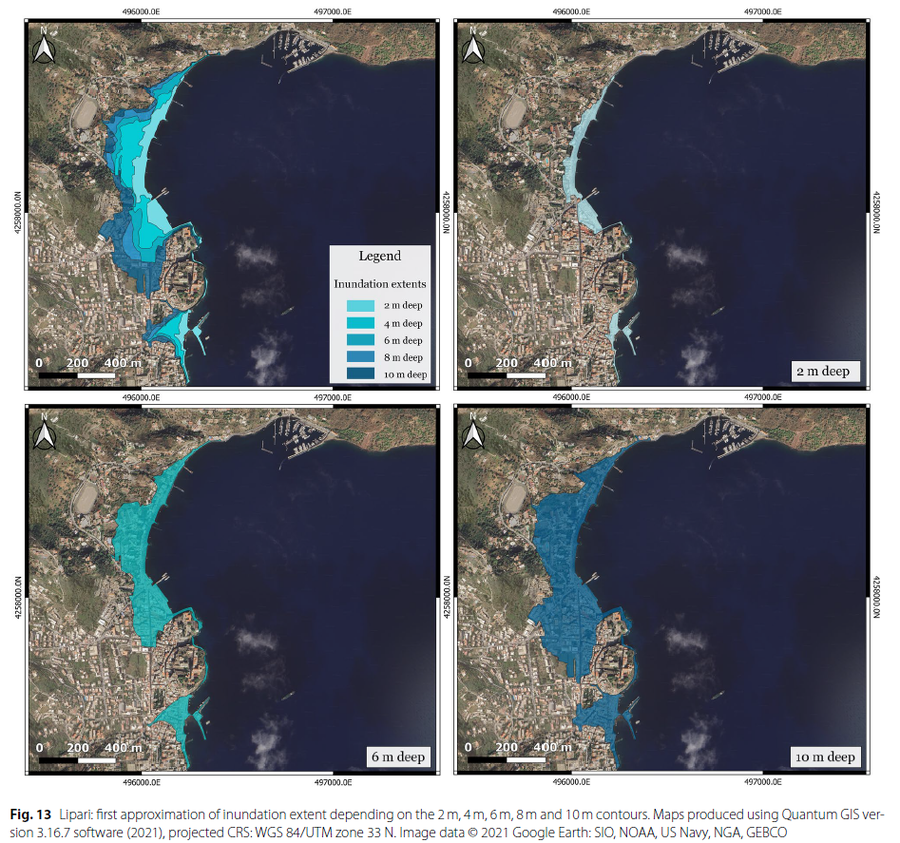
Lipari: first approximation of inundation extent depending on the 2 m, 4 m, 6 m, 8 m and 10 m contours

Lipari, Italy, 2026

Figure 13 in: Bonilauri, E. M., & Harris, A. J. (2026). Tsunami evacuation times and routes to safe zones II: a GIS-based approach applied to Vulcano and Lipari (Aeolian Islands, Italy) to assess escape route challenges for low-lying harbour areas. Journal of Applied Volcanology, 15(1), 5.


This hazard map is the result of scientific research and was published in academic literature. It is presented here to serve as an example of the map type or the map-making methodology. It is NOT the official, operational map. For the current operational hazard map, please consult the proper institutional authorities.

Click on image for full-size map. If link seems broken, try the archived version.

Map Data

Map ID4423
Hazard Process(es)Tsunami
Hazard Zone PresentationSingle hazard: A single hazard process is represented on a series of small map panels of similar sizes
Temporal ScaleBackground, or long-term, map
Spatial ScaleVolcano and surrounding area
Publication FormatFigure in a journal article
Zonation Method(s)Scenario modeling
Zonation Model(s)Generic spatial model (No reference)
Scenario(s) ConsideredNo scenarios were discernable from the map
Hazard Zone Label(s)Estimated value or Hazard Impact Metric
Probability Definition(s)No probability definition was discernable from the map
PurposeScientific interest: Intended for scientific research and general scientific interest; usually published in academic journals
AudienceScientists (usually in scientific publication)
Language(s)English
Basemap(s)Satellite image
Basemap overlay(s)
DiemsionalityPlanimetric (2D or map) view
Color SchemeDark to Light (color)
Volcanic Alert Level System
Go to Global Volcanism Program page for Lipari →