
Advanced Search for Maps
Showing 1-4 of 4
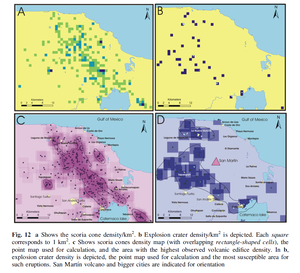
Figure in a journal article
Fig. 12 a Shows the scoria cone density/km². b Explosion crater density/km² is depicted. Each square corresponds to 1 km2. c Shows scoria cones density map (with overlapping rectangle-shaped cells), the point map used for calculation, and the area with the highest observed volcanic edifice density.
Figure 12 in: Sieron, K., Capra, L., & Rodríguez-Elizararrás, S. (2014). Hazard assessment at San Martín volcano based on geological record, numerical modeling, and spatial analysis. Natural hazards, 70(1), 275-297. https://doi.org/10.1007/s11069-013-0807-7
Official, Figure in hazard assessment
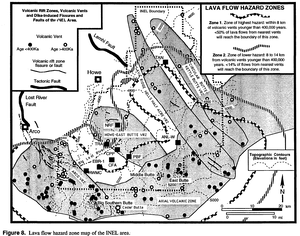
Lava flow hazard zone map of the INEL area
Figure 8 in: Hackett, W.R. & Smith, R.P. (1994). Volcanic hazards of the Idaho National Engineering Laboratory and adjacent areas (No. INEL--94/0276). Lockheed Martin Idaho Technologies Co..
Official, Figure in hazard assessment
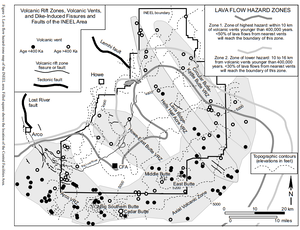
Lava Flow Hazard Zones
Figure 5 in: Hackett, W.R., Smith, R.P., & Khericha, S. (2002). Volcanic hazards of the Idaho National Engineering and Environmental Laboratory, southeast Idaho. In: Bonnichsen, B., White, C.M., and McCurry, M. (eds.). Tectonic and Magmatic Evolution of the Snake River Plain Volcanic Province. Idaho Geological Survey Bulletin 30, p. 461-482.
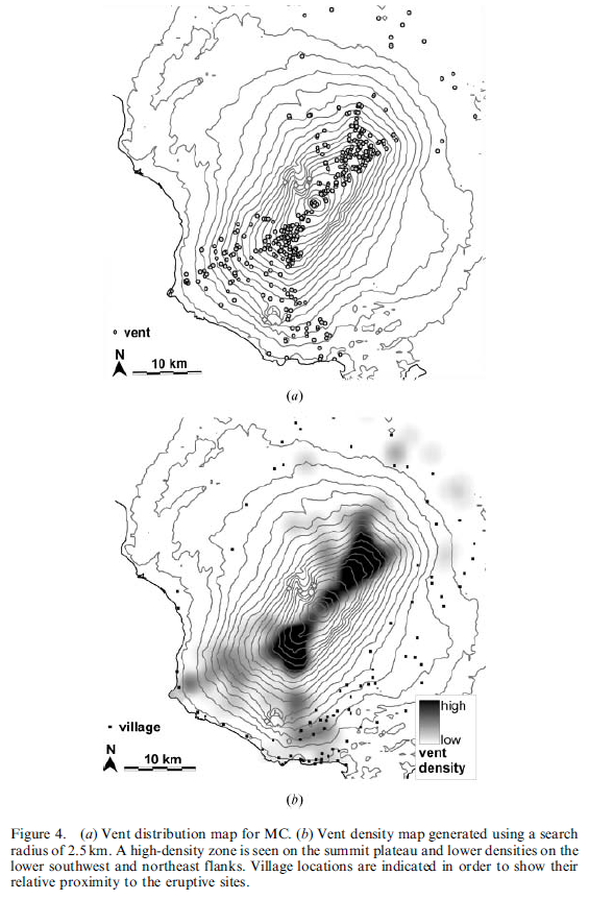
Figure in a journal article
Vent distribution map for MC. Vent density map generated using a search radius of 2.5 km
Figure 4 in: Bonne, K., Kervyn, M., Cascone, L., Njome, S., Van Ranst, E., Suh, E., Ayonghe, S., & Ernst, G. (2008). A new approach to assess long‐term lava flow hazard and risk using GIS and low‐cost remote sensing: the case of Mount Cameroon, West Africa. International Journal of Remote Sensing, 29(22), 6539-6564. https://doi.org/10.1080/01431160802167873