
Advanced Search for Maps
Showing 1-10 of 11
Official, Figure in a journal article
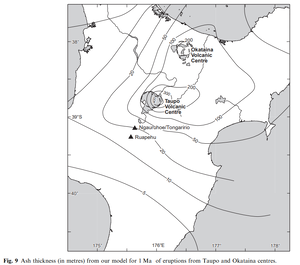
Ash thickness (in metres) from our model for 1 Ma of eruptions from Taupo and Okataina centres
Figure 9 in: Hurst, T. & Smith, W. (2010). Volcanic ashfall in New Zealand–probabilistic hazard modelling for multiple sources. New Zealand Journal of Geology and Geophysics, 53(1), 1-14. https://doi.org/10.1080/00288301003631129
Official, Figure in hazard assessment
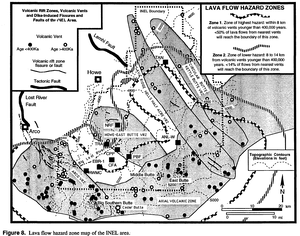
Lava flow hazard zone map of the INEL area
Figure 8 in: Hackett, W.R. & Smith, R.P. (1994). Volcanic hazards of the Idaho National Engineering Laboratory and adjacent areas (No. INEL--94/0276). Lockheed Martin Idaho Technologies Co..
Official, Figure in hazard assessment
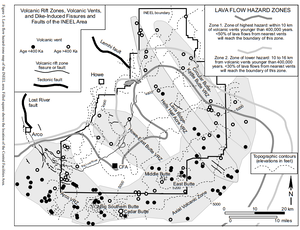
Lava Flow Hazard Zones
Figure 5 in: Hackett, W.R., Smith, R.P., & Khericha, S. (2002). Volcanic hazards of the Idaho National Engineering and Environmental Laboratory, southeast Idaho. In: Bonnichsen, B., White, C.M., and McCurry, M. (eds.). Tectonic and Magmatic Evolution of the Snake River Plain Volcanic Province. Idaho Geological Survey Bulletin 30, p. 461-482.
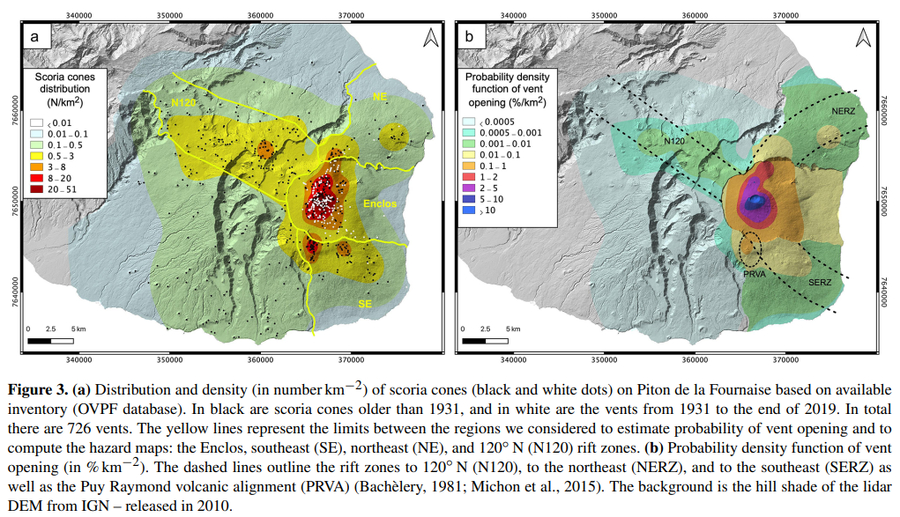
Figure in a journal article
Probability density function of vent opening (in % km−2)
Figure 3 in: Chevrel, M. O., Favalli, M., Villeneuve, N., Harris, A. J., Fornaciai, A., Richter, N., Derrien, A., Di Muro, A., & Peltier, A. (2021). Lava flow hazard map of Piton de la Fournaise volcano. Natural Hazards and Earth System Sciences, 21(8), 2355-2377. https://doi.org/10.5194/nhess-21-2355-2021, 2021
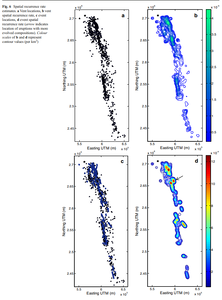
Figure in a journal article
Spatial recurrence rate estimates
Figure 6 in: Runge, M. G., Bebbington, M. S., Cronin, S. J., Lindsay, J. M., Kenedi, C. L., & Moufti, M. R. H. (2014). Vents to events: determining an eruption event record from volcanic vent structures for the Harrat Rahat, Saudi Arabia. Bulletin of Volcanology, 76(3), 1-16. https://doi.org/10.1007/s00445-014-0804-z
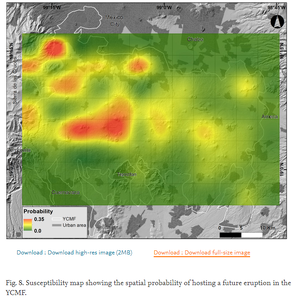
Figure in a journal article
Susceptibility map showing the spatial probability of hosting a future eruption in the YCMF
Figure 8 in: Nieto-Torres, A. & Martin Del Pozzo, A.L. (2019). Spatio-temporal hazard assessment of a monogenetic volcanic field, near México City. Journal of Volcanology and Geothermal Research, 371, 46-58. https://doi.org/10.1016/j.jvolgeores.2019.01.006
Official, Figure in a journal article
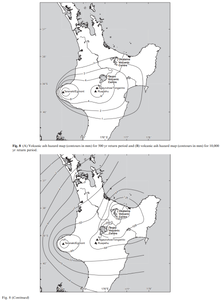
Volcanic ash hazard map (contours in mm) for 500 yr return period and volcanic ash hazard map (contours in mm) for 10,000 yr return period
Figure 8 in: Hurst, T. & Smith, W. (2010). Volcanic ashfall in New Zealand–probabilistic hazard modelling for multiple sources. New Zealand Journal of Geology and Geophysics, 53(1), 1-14. https://doi.org/10.1080/00288301003631129
Official, Figure in hazard assessment
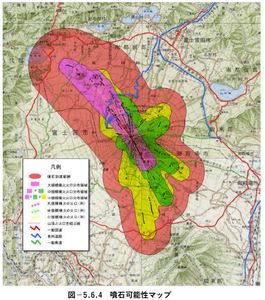
Volcanic bomb possibility map
Figure 5.6.4 in: Mt. Fuji Hazard Map Review Committee. (2004). Mt. Fuji Hazard Map Review Committee Report. June 2004. https://www.bousai.go.jp/kazan/fuji_map/pdf/report_200406.pdf
Official, Figure in hazard assessment
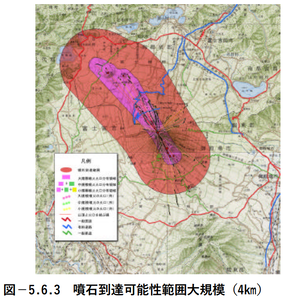
Volcanic bomb reachability range large scale (4km)
Figure 5.6.3 in: Mt. Fuji Hazard Map Review Committee. (2004). Mt. Fuji Hazard Map Review Committee Report. June 2004. https://www.bousai.go.jp/kazan/fuji_map/pdf/report_200406.pdf
Official, Figure in hazard assessment
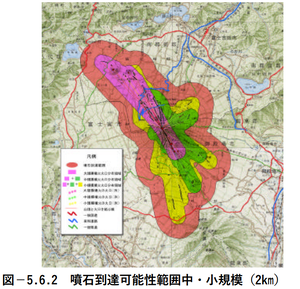
Volcanic bomb reachability range medium/small scale (2km)
Figure 5.6.2 in: Mt. Fuji Hazard Map Review Committee. (2004). Mt. Fuji Hazard Map Review Committee Report. June 2004. https://www.bousai.go.jp/kazan/fuji_map/pdf/report_200406.pdf
Page: 1 2