
Advanced Search for Maps
Showing 1-4 of 4
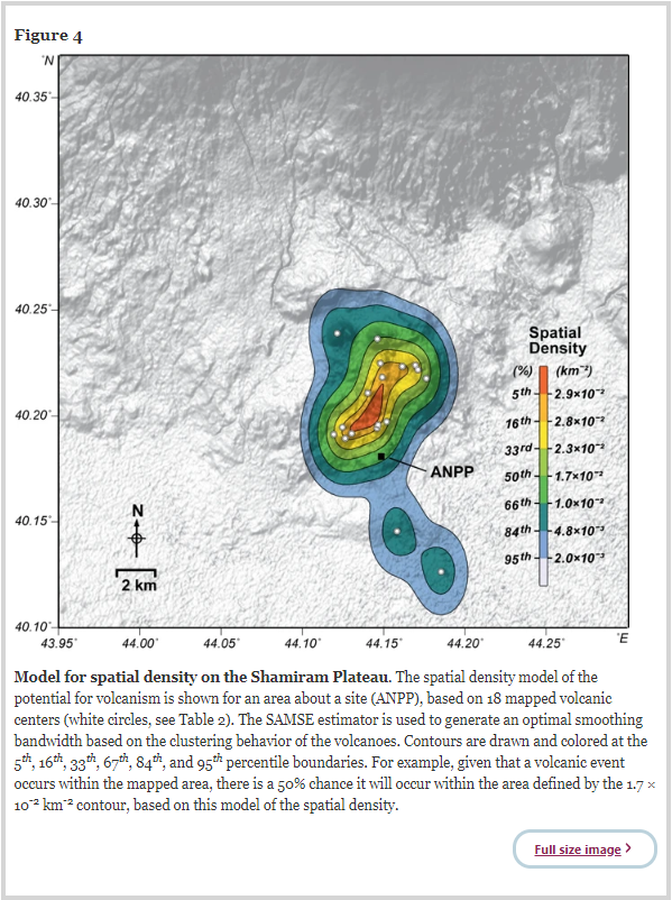
Figure in a journal article
Model for spatial density on the Shamiram Plateau
Figure 4 in: Connor, L.J., Connor, C.B., Meliksetian, K., Savov, I. (2012). Probabilistic approach to modeling lava flow inundation: a lava flow hazard assessment for a nuclear facility in Armenia. Journal of Applied Volcanology 1, 3. https://doi.org/10.1186/2191-5040-1-3
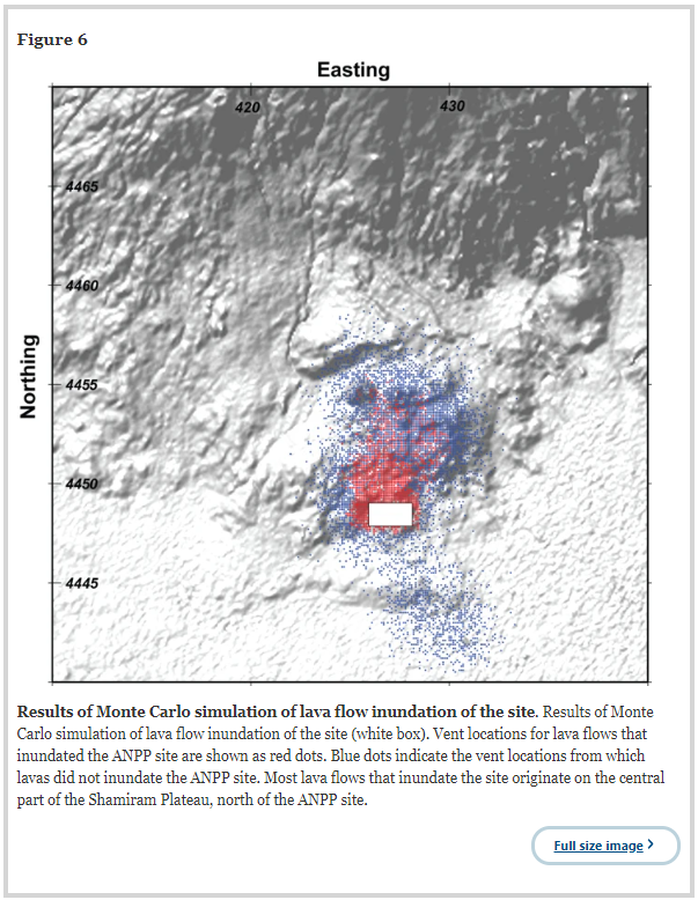
Figure in a journal article
Results of Monte Carlo simulation of lava flow inundation of the site
Figure 6 in: Connor, L.J., Connor, C.B., Meliksetian, K., Savov, I. (2012). Probabilistic approach to modeling lava flow inundation: a lava flow hazard assessment for a nuclear facility in Armenia. Journal of Applied Volcanology 1, 3. https://doi.org/10.1186/2191-5040-1-3
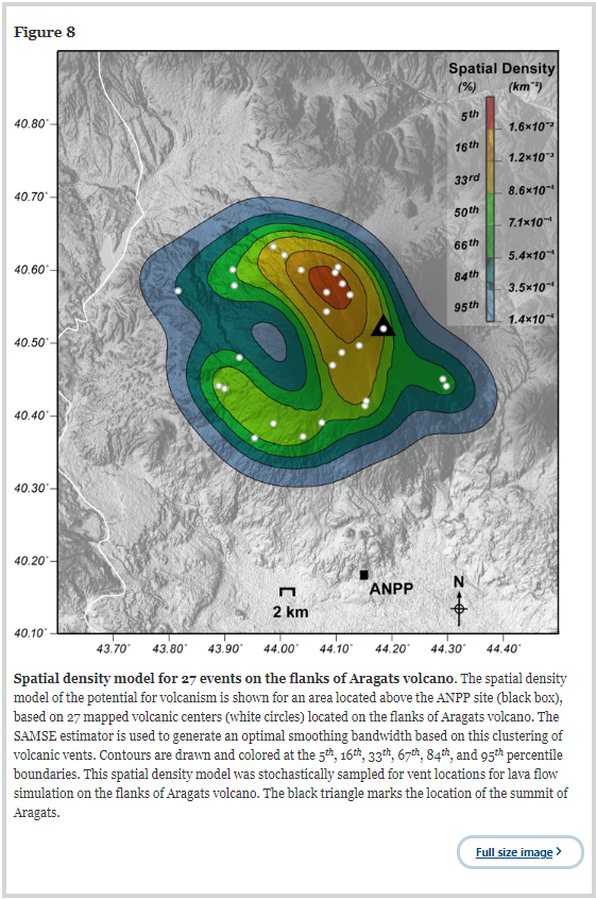
Figure in a journal article
Spatial density model for 27 events on the flanks of Aragats volcano
Figure 8 in: Connor, L.J., Connor, C.B., Meliksetian, K., Savov, I. (2012). Probabilistic approach to modeling lava flow inundation: a lava flow hazard assessment for a nuclear facility in Armenia. Journal of Applied Volcanology 1, 3. https://doi.org/10.1186/2191-5040-1-3
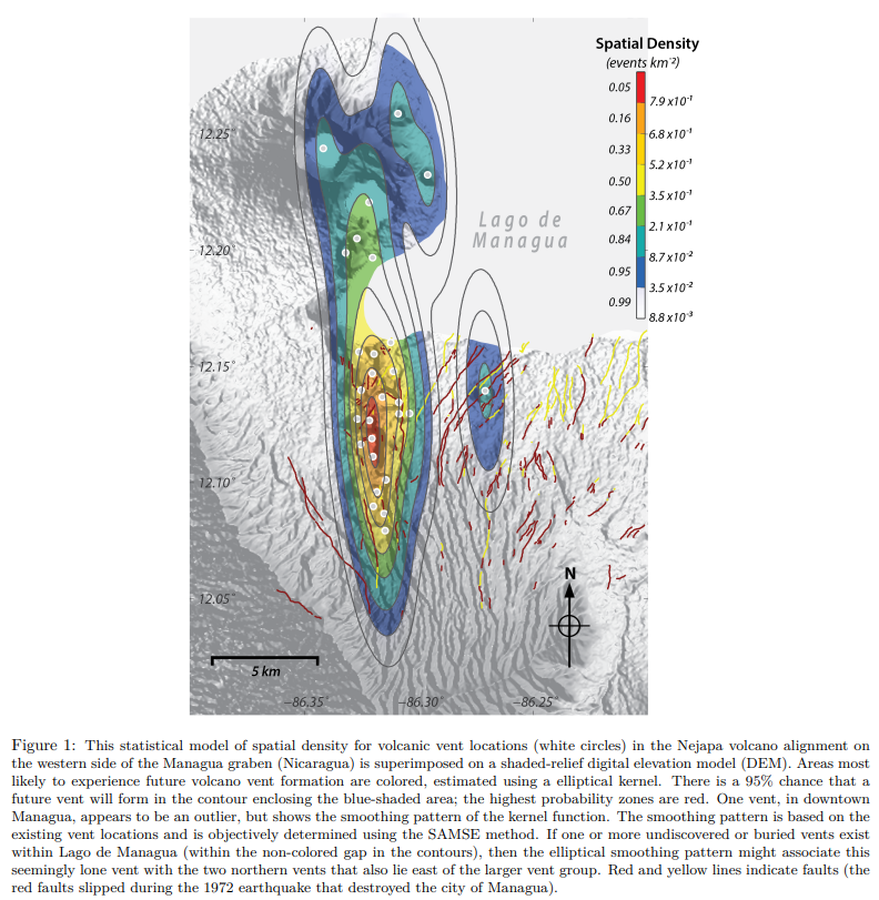
Figure in a journal article
This statistical model of spatial density for volcanic vent locations (white circles) in the Nejapa volcano alignment on the western side of the Managua graben (Nicaragua) is superimposed on a shaded-relief digital elevation model (DEM)
Figure 1 in: Connor, C. B., Connor, L. J., Germa, A., Richardson, J. A., Bebbington, M. S., Gallant, E., & Saballos, A. (2019). How to use kernel density estimation as a diagnostic and forecasting tool for distributed volcanic vents. Statistics in Volcanology, 4 (3). p. 1-25. http://dx.doi.org/10.5038/2163-338X.4.3