
Advanced Search for Maps
Showing 1501-1510 of 2217
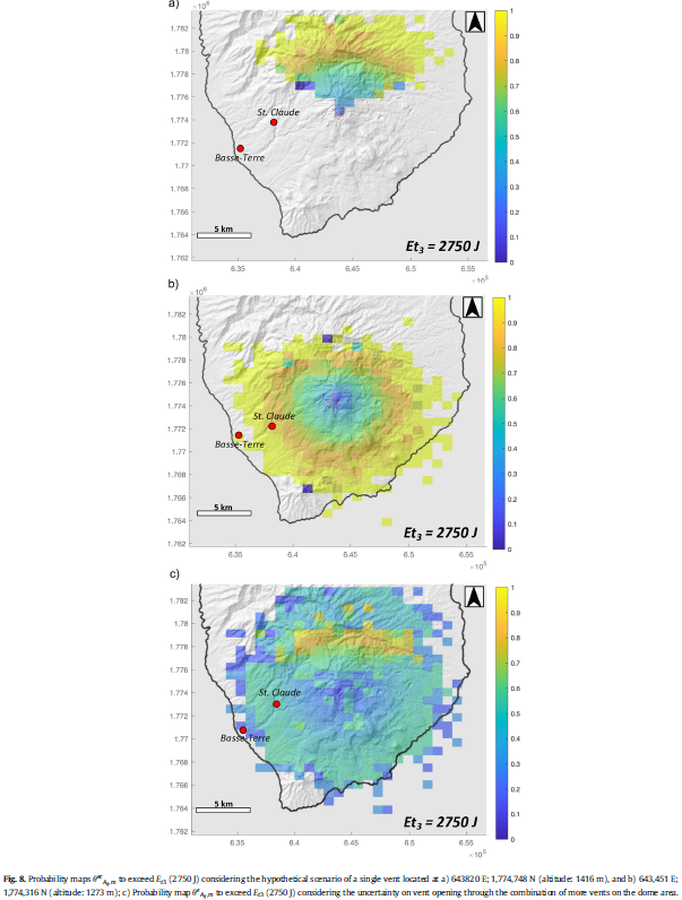
Figure in a journal article
Probability maps to exceed Et3 (2750 J) considering the hypothetical scenario of a single vent
Figure 8 in: Massaro, S., Rossi, E., Sandri, L., Bonadonna, C., Selva, J., Moretti, R., & Komorowski, J. C. (2022). Assessing hazard and potential impact associated with volcanic ballistic projectiles: The example of La Soufrière de Guadeloupe volcano (Lesser Antilles). Journal of volcanology and geothermal research, 423, 107453. https://doi.org/10.1016/j.jvolgeores.2021.107453
Official, Map in a booklet, long fact-sheet, or handbook
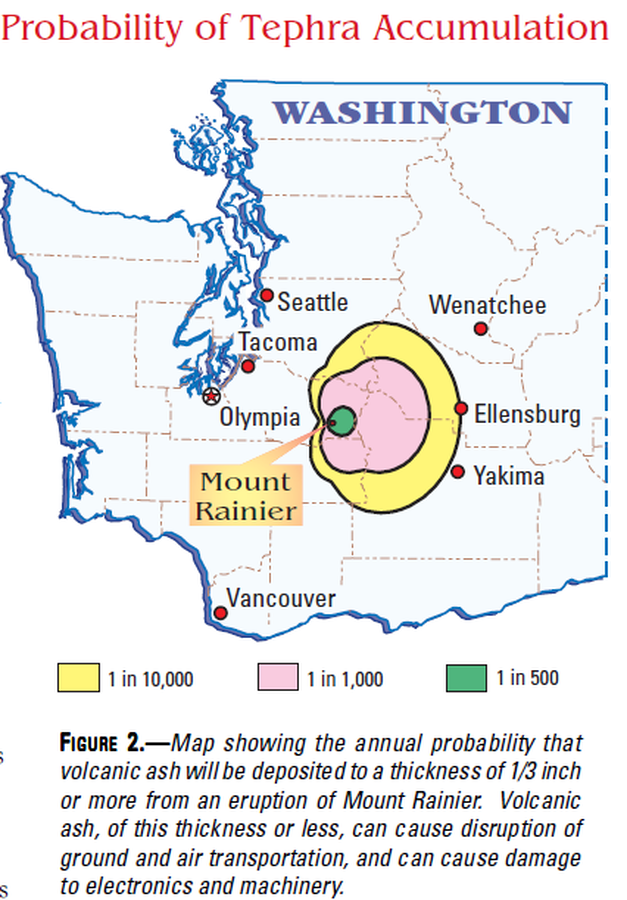
Probability of Tephra Accumulation
Figure 2 in: Driedger, C.L. & Scott, K.M. (2002). Mount Rainier: learning to live with volcanic risk. U.S. Geological Survey, Fact Sheet 034-02, 4 p. https://doi.org/10.3133/fs03402
Official, Figure in hazard assessment
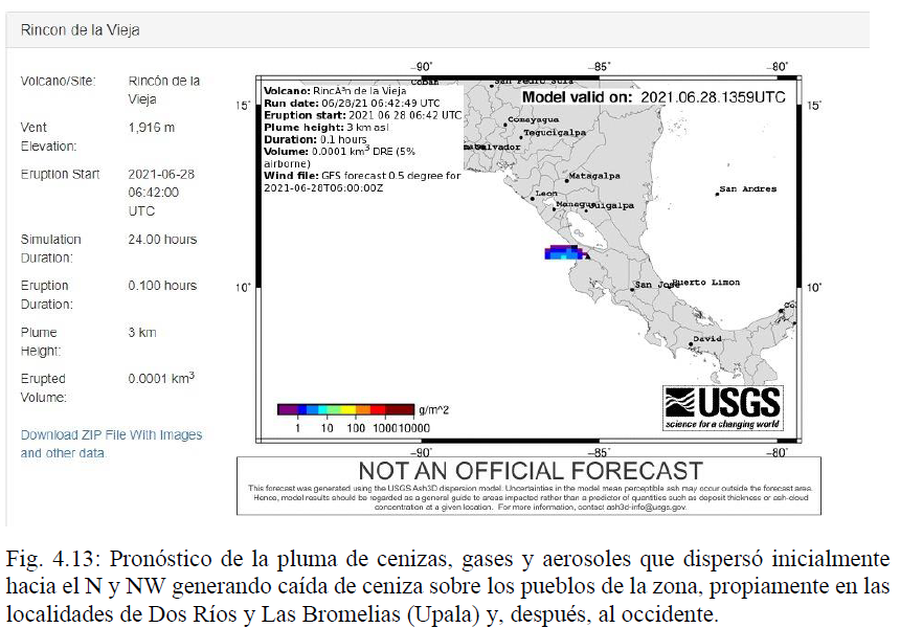
Pronóstico de la pluma de cenizas, gases y aerosoles que dispersó inicialmente hacia el N y NW generando caída de ceniza sobre los pueblos de la zona, propiamente en las localidades de Dos Ríos y Las Bromelias (Upala) y, después, al occidente
(Forecast of the plume of ash, gases and aerosols that initially dispersed towards the N and NW, generating ash fall on the towns in the area, specifically in the towns of Dos Ríos and Las Bromelias (Upala) and, later, to the west)
Figure 4.13 in: Alvarado, G.E., Brenes-André, J., Venegas, L., Alpízar, Y., Núñez, S., Sánchez, M., Abarca, K., Abarca, J., Báez, W.A., Sibaja, J.P., Esquivel, L., & Arcia, T. (2022). Análisis del Peligro Volcánico del Rincón de la Vieja, Costa Rica. Instituto Costarricense de Electricidad (ICE). Setiembre 2022.
Official, Figure in hazard assessment
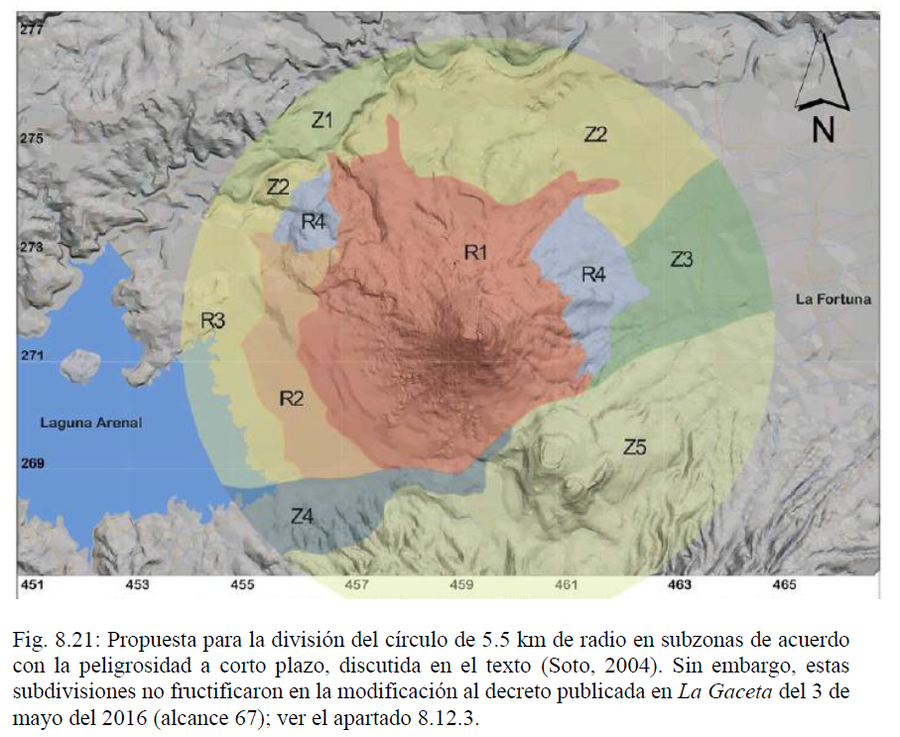
Propuesta para la división del círculo de 5.5 km de radio en subzonas de acuerdo con la peligrosidad a corto plazo, discutida en el texto (Soto, 2004)
(Proposal for the division of the 5.5 km radius circle into subzones according to short-term danger, discussed in the text (Soto, 2004))
Figure 8.21 in: Alvarado, G.E., Brenes-André, F., Núñez, D., Borbón, J., Ramírez, M.A., Alpízar, Y., Núñez, S., Sibaja, J.P., Esquivel, L. (2023). Actualización del Análisis del Peligro Volcánico del Arenal, Costa Rica. Instituto Costarricense de Electricidad (ICE). Mayo 2023.

Figure in a journal article
Provisional volcanic hazard map for a large explosive eruption similar to the 1680 event
Figure 5 in: Komorowski JC., Morin J., Jenkins S., & Kelman I. (2016) Challenges of Volcanic Crises on Small Islands States. In: Fearnley C.J., Bird D.K., Haynes K., McGuire W.J., Jolly G. (eds) Observing the Volcano World. Advances in Volcanology. International Association of Volcanology and Chemistry of the Earth’s Interior – IAVCEI. Springer. https://doi.org/10.1007/11157_2015_15. Adapted from: Day, S.F., Faria, B.V.E. (2009). A geological hazard map of the Island of Fogo showing broad distribution of volcanic and other hazards. MIA-VITA Workshop, São Filipe, Fogo.
Official, Figure in hazard assessment
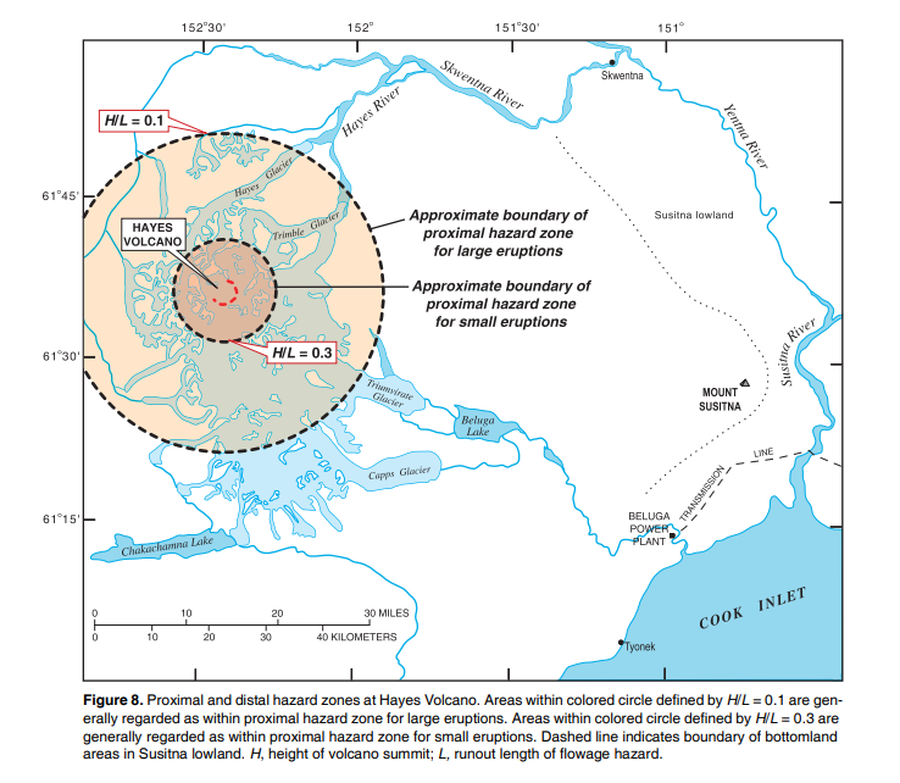
Proximal and distal hazard zones at Hayes Volcano
Figure 8 in: Waythomas, C.F. & Miller, T.P. (2002). Preliminary volcano-hazard assessment for Hayes Volcano, Alaska. U.S. Geological Survey, Open-File Report 02-072, 33 p., 1 plate. https://doi.org/10.3133/ofr0272
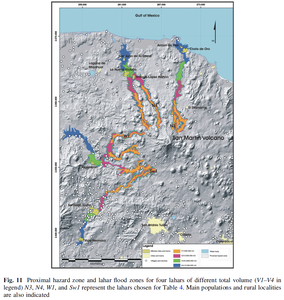
Figure in a journal article
Proximal hazard zone and lahar flood zones for four lahars of different total volume
Figure 11 in: Sieron, K., Capra, L., & Rodríguez-Elizararrás, S. (2014). Hazard assessment at San Martín volcano based on geological record, numerical modeling, and spatial analysis. Natural hazards, 70(1), 275-297. https://doi.org/10.1007/s11069-013-0807-7
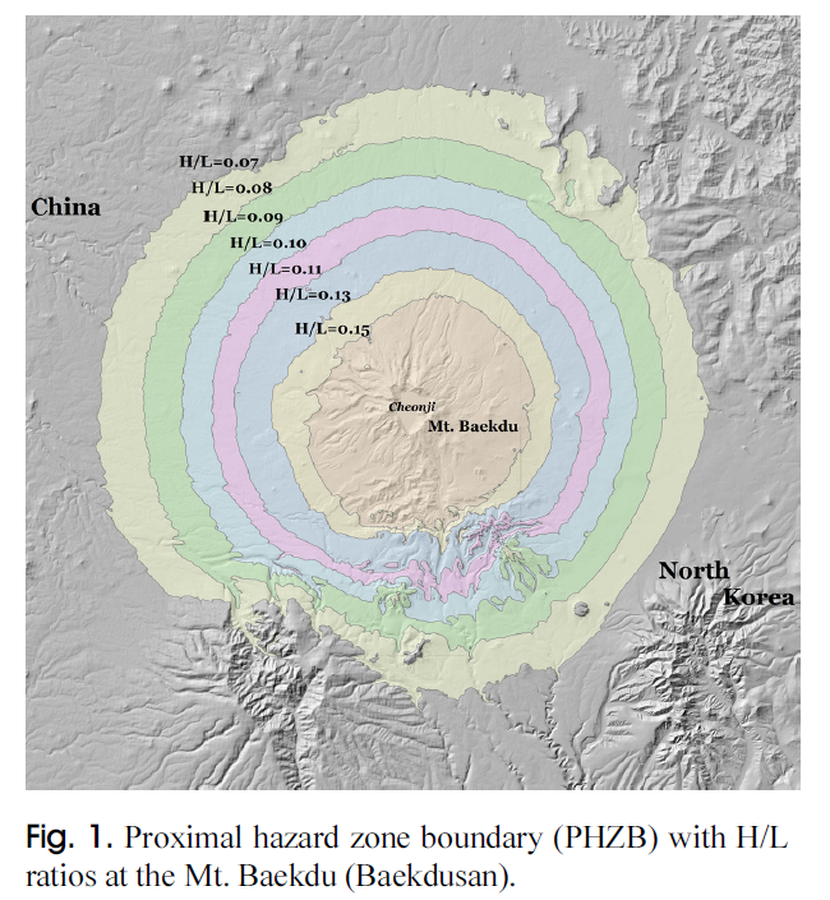
Figure in a journal article
Proximal hazard zone boundary (PHZB) with H/L ratios at the Mt. Baekdu (Baekdusan)
Figure 1 in: Yun, S. H. & Chang, C. (2017). Prediction of Lahar Flow Inundation Areas Using LAHARZ_py Program: Application for the Mt. Baekdu Volcano. Economic and Environmental Geology, 50(4), 277-286. https://doi.org/10.9719/EEG.2017.50.4.277
Official, Insert/poster-size map with accompanying report
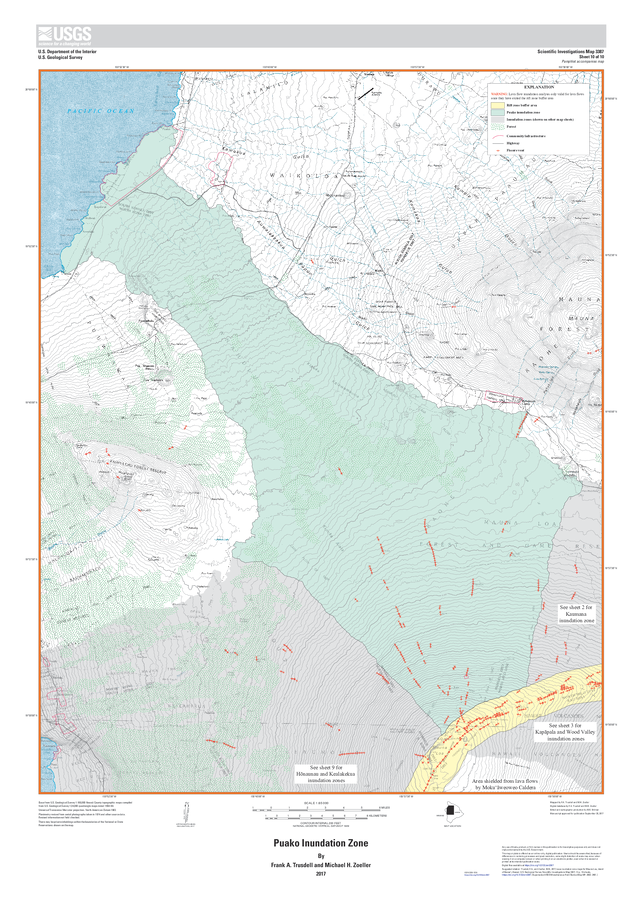
Puako Inundation Zone
Sheet 10 in: Trusdell, F.A. & Zoeller, M.H. (2017). Lava inundation zone maps for Mauna Loa, Island of Hawaiʻi, Hawaii. U.S. Geological Survey, Scientific Investigations Map 3387, 12 p., 10 sheets. https://doi.org/10.3133/sim3387
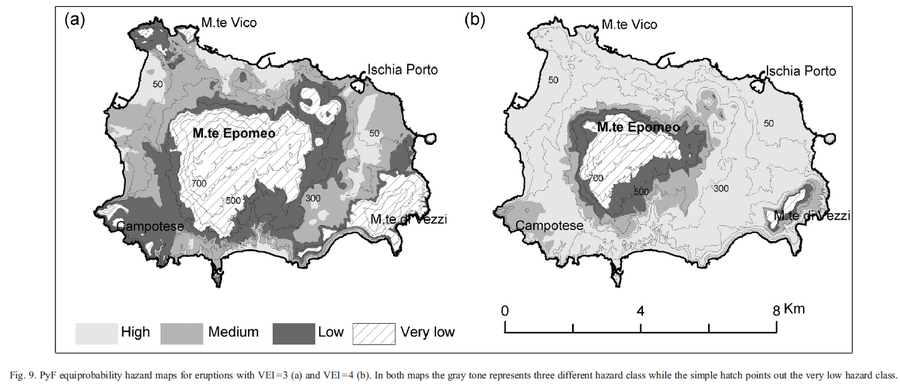
Figure in a journal article
PyF equiprobability hazard maps for eruptions with VEI = 3 and VEI = 4
Figure 9 in: Alberico, I., Lirer, L., Petrosino, P., & Scandone, R. (2008). Volcanic hazard and risk assessment from pyroclastic flows at Ischia island (southern Italy). Journal of volcanology and geothermal research, 171(1-2), 118-136.