
Advanced Search for Maps
Showing 1551-1560 of 2217
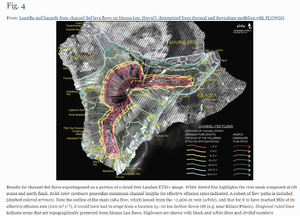
Figure in a journal article
Results for channel-fed flows superimposed on a portion of a cloud-free Landsat ETM+ image
Figure 4 in: Rowland, S. K., Garbeil, H., & Harris, A. J. (2005). Lengths and hazards from channel-fed lava flows on Mauna Loa, Hawai ‘i, determined from thermal and downslope modeling with FLOWGO. Bulletin of Volcanology, 67(7), 634-647. https://doi.org/10.1007/s00445-004-0399-x
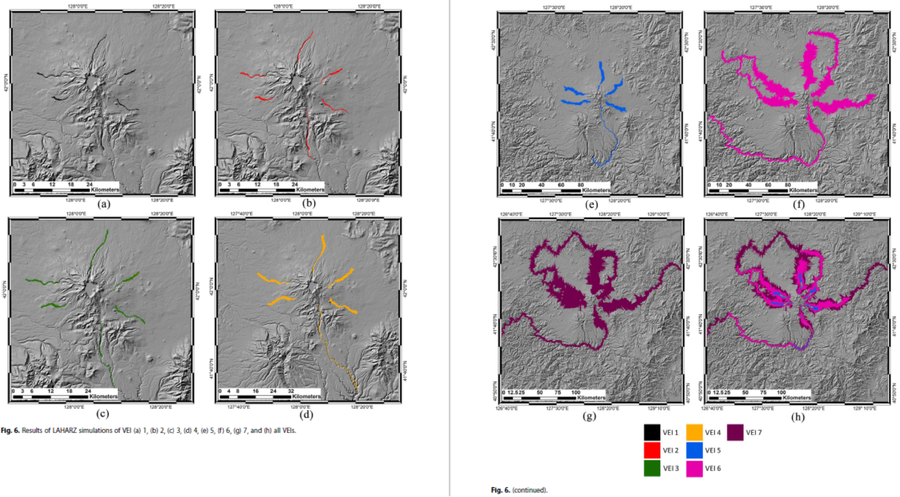
Figure in a journal article
Results of LAHARZ simulations of VEI (a) 1, (b) 2, (c) 3, (d) 4, (e) 5, (f) 6, (g) 7, and (h) all VEIs
Figure 6 in: Achmad, A.R., Lee, S., Park, S. Eom, J., & Lee, C.-W. (2020). Estimating the potential risk of the Mt. Baekdu Volcano using a synthetic interferogram and the LAHARZ inundation zone. Geosciences Journal. 24, 755–768. https://doi.org/10.1007/s12303-020-0032-9
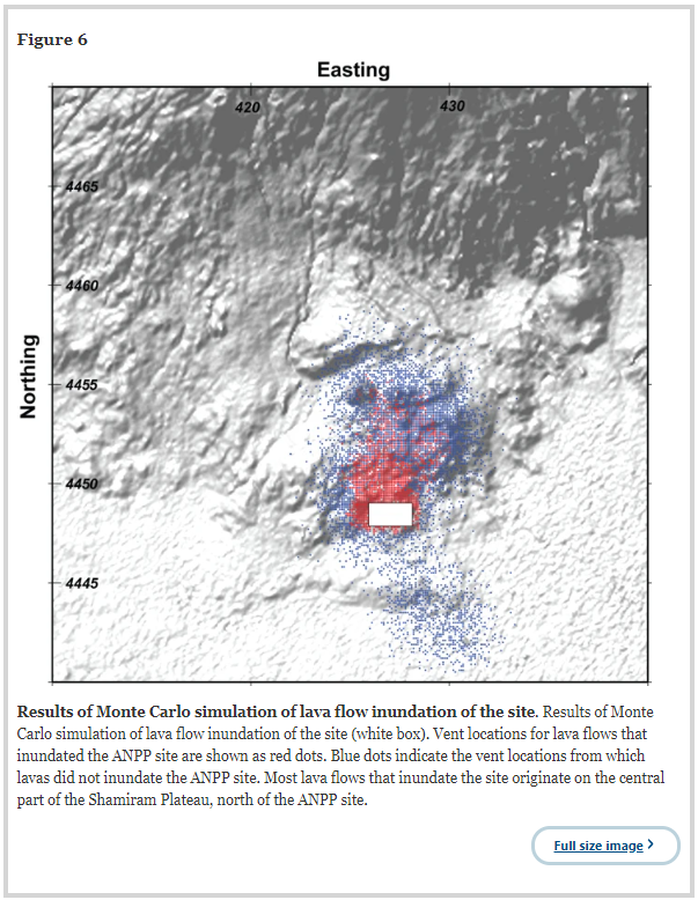
Figure in a journal article
Results of Monte Carlo simulation of lava flow inundation of the site
Figure 6 in: Connor, L.J., Connor, C.B., Meliksetian, K., Savov, I. (2012). Probabilistic approach to modeling lava flow inundation: a lava flow hazard assessment for a nuclear facility in Armenia. Journal of Applied Volcanology 1, 3. https://doi.org/10.1186/2191-5040-1-3
Official, Figure in a journal article
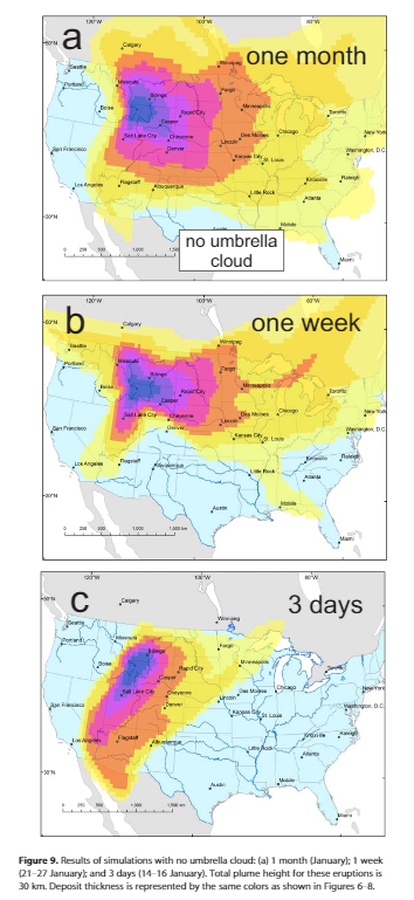
Results of simulations with no umbrella cloud: (a) 1 month (January); 1 week(21–27 January); and 3 days (14–16 January
Figure 9 in: Mastin, L.G., Van Eaton, A.R., & Lowenstern, J.B. (2014). Modeling ash fall distribution from a Yellowstone supereruption. Geochemistry, Geophysics, Geosystems, 15(8), 3459-3475. https://doi.org/10.1002/2014GC005469
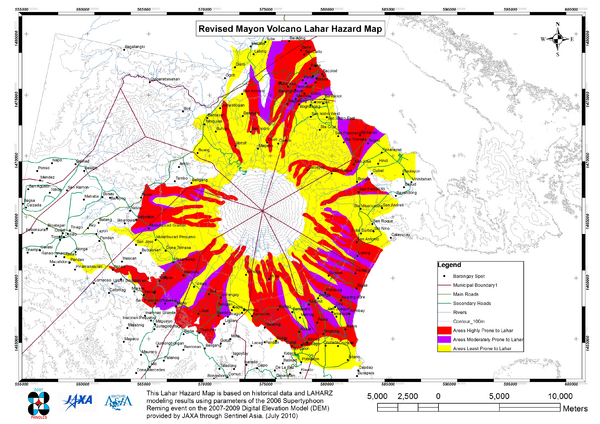
Official, Map sheet or poster
Revised Mayon Volcano Lahar Hazard Map
Philippine Institute of Volcanology and Seismology (PHIVOLCS). Revised Mayon Volcano Hazard Map.
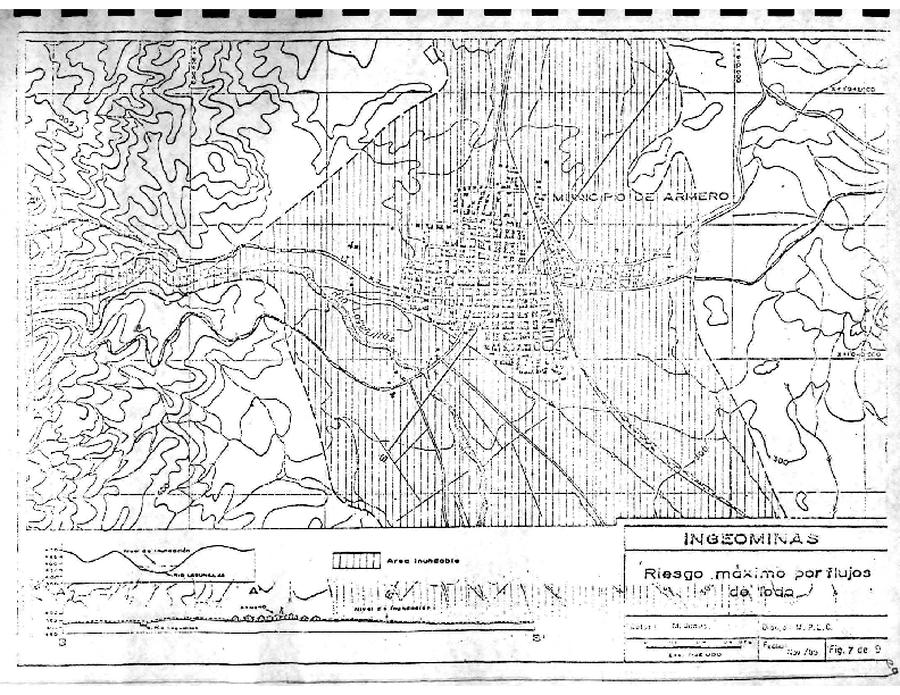
Official, Figure in hazard assessment
Riesgo máximo por flujos de lodo - Armero
(Maximum risk due to mudflows - Armero)
Figure 7 in: Instituto Colombiano de Geología y Minería (INGEOMINAS). (1985). Mapa de Riesgos Volcánicos Potenciales del Nevado del Ruiz. Texto Explicativa, 32 pp. Instituto Colombiano de Geología y Minería (INGEOMINAS). Medellin, Nov. 14/85.
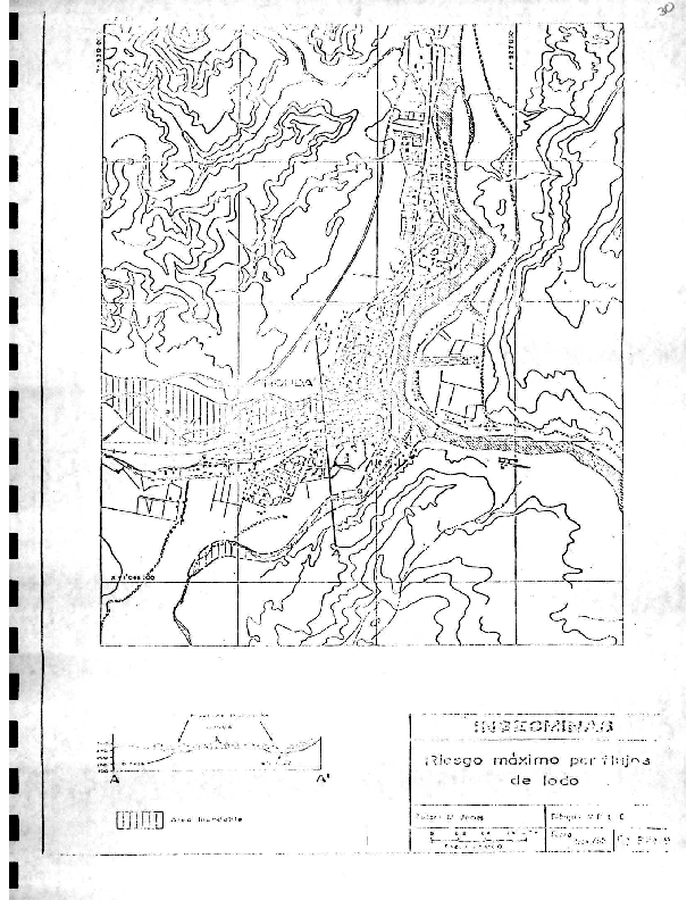
Official, Figure in hazard assessment
Riesgo máximo por flujos de lodo - Honda
(Maximum risk due to mudflows - Honda)
Figure 8 in: Instituto Colombiano de Geología y Minería (INGEOMINAS). (1985). Mapa de Riesgos Volcánicos Potenciales del Nevado del Ruiz. Texto Explicativa, 32 pp. Instituto Colombiano de Geología y Minería (INGEOMINAS). Medellin, Nov. 14/85.
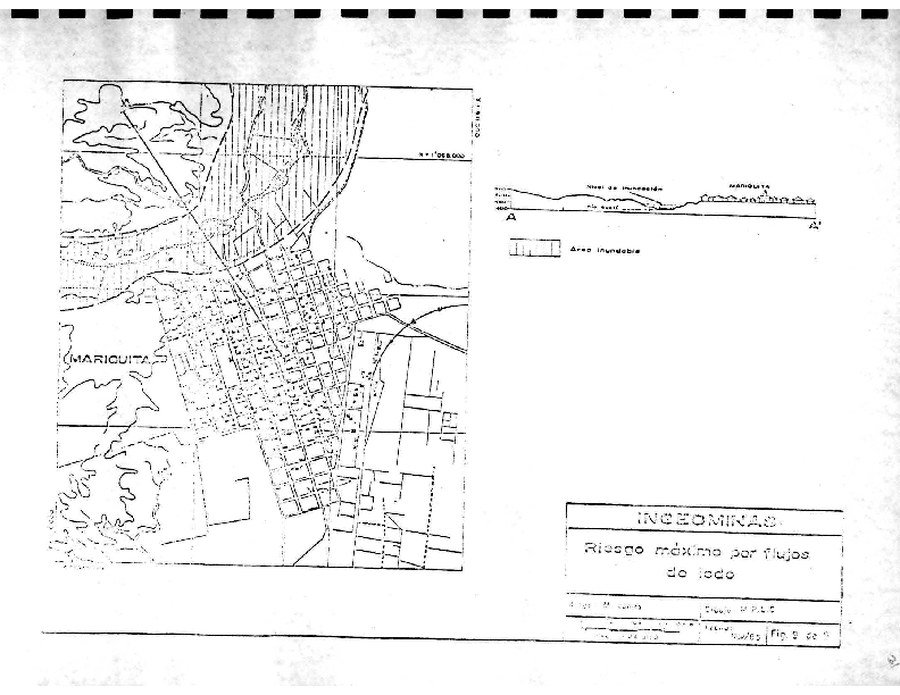
Official, Figure in hazard assessment
Riesgo máximo por flujos de lodo - Mariquita
(Maximum risk due to mudflows - Mariquita)
Figure 9 in: Instituto Colombiano de Geología y Minería (INGEOMINAS). (1985). Mapa de Riesgos Volcánicos Potenciales del Nevado del Ruiz. Texto Explicativa, 32 pp. Instituto Colombiano de Geología y Minería (INGEOMINAS). Medellin, Nov. 14/85.
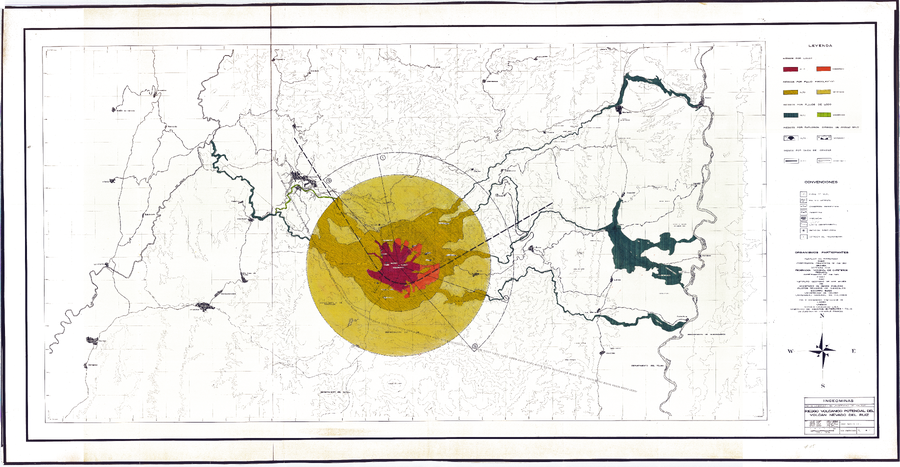
Official, Map sheet or poster
Riesgo Volcanico Potencial del Volcan Nevado del Ruiz (Noviembre 12 de 1985)
(Potential Volcanic Risk of the Nevado del Ruiz Volcano (November 12, 1985))
Cepeda, H., James, M., Murcia, L.A., Parra, E., Salinas, R.Y. & Vergara, H. (1985). Mapa de Riesgos Volcánicos Potenciales del Nevado del Ruiz. Esc. 1:100.000. Memoria Explicativa, 28 pp. Instituto Colombiano de Geología y Minería (INGEOMINAS). Medellin, Nov. 12/85.
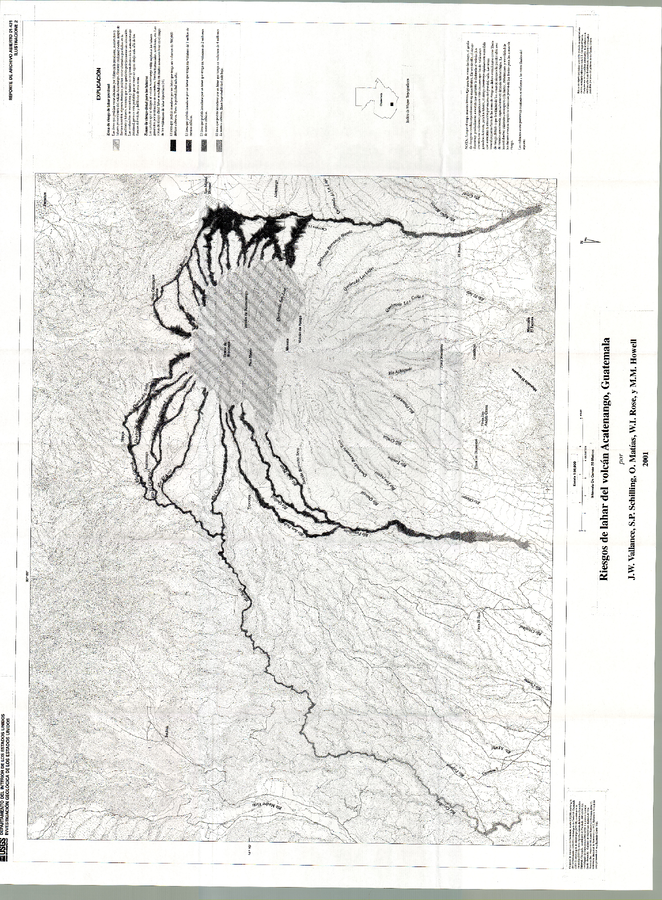
Official (foreign agency), Insert/poster-size map with accompanying report
Riesgos de Lahar del Volcán Acatenango, Guatemala
(Lahar Hazards from Acatenango Volcano, Guatemala)
Plate 2 in: Vallance, J.W., Schilling, S.P., Matías, O., Rose, W.I. & Howell, M.M. (2001). Riesgos Volcánicos en Los Volcanes Fuego and Acatenango, Guatemala. U.S. Geological Survey, Reporte de archivo abierto 01-431.