
Advanced Search for Maps
Showing 1711-1720 of 2217
Official, Figure in hazard assessment
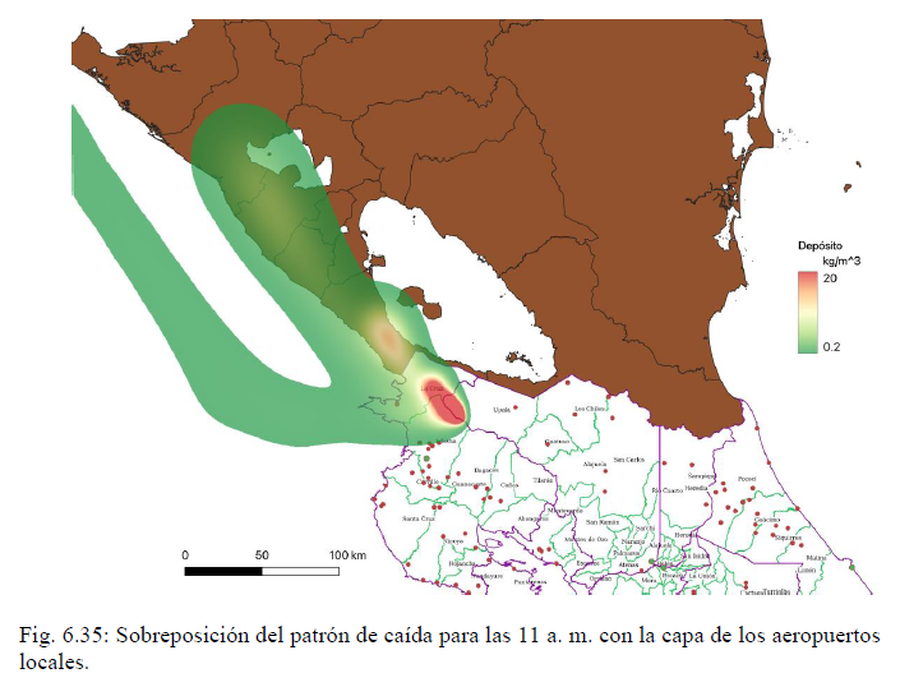
Sobreposición del patrón de caída para las 11 a. m. con la capa de los aeropuertos locales
(Fall pattern overlay for 11 a.m. with the layer of local airports)
Figure 6.35 in: Alvarado, G.E., Brenes-André, J., Venegas, L., Alpízar, Y., Núñez, S., Sánchez, M., Abarca, K., Abarca, J., Báez, W.A., Sibaja, J.P., Esquivel, L., & Arcia, T. (2022). Análisis del Peligro Volcánico del Rincón de la Vieja, Costa Rica. Instituto Costarricense de Electricidad (ICE). Setiembre 2022.
Official, Figure on website
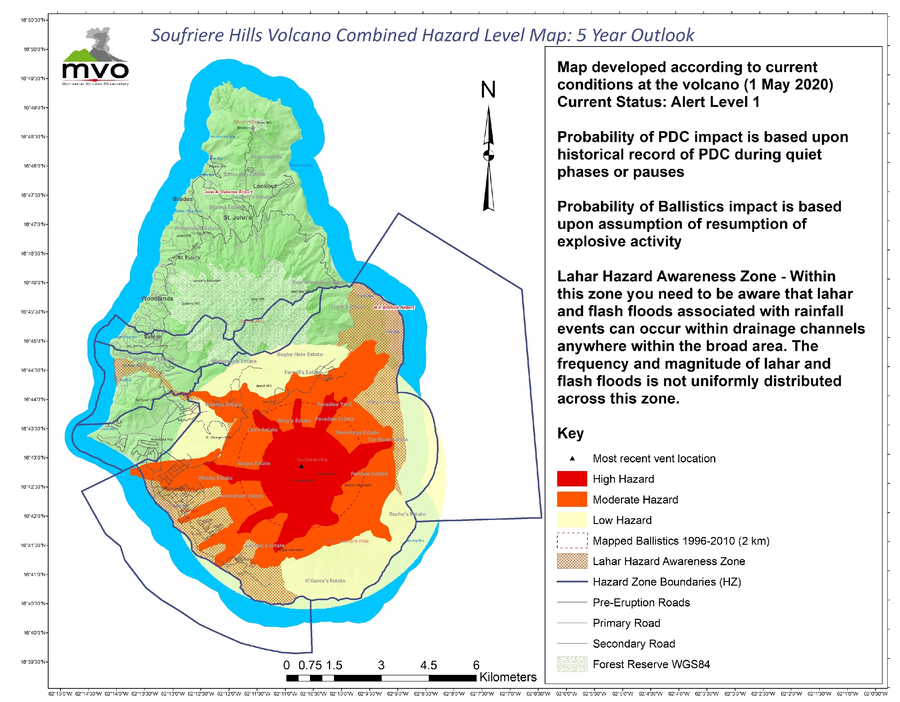
Soufriere Hills Volcano Combined Hazard Level Map: 5 Year Outlook
Miller, V. et al. (2020) reproduced in: Montserrat Volcano Observatory. (2026). Volcanic Hazard-Previous Volcanic Hazard Maps. https://www.mvo.ms/hazards/volcanic-hazard/. Accessed 02-24-2016.
Official, Figure on website
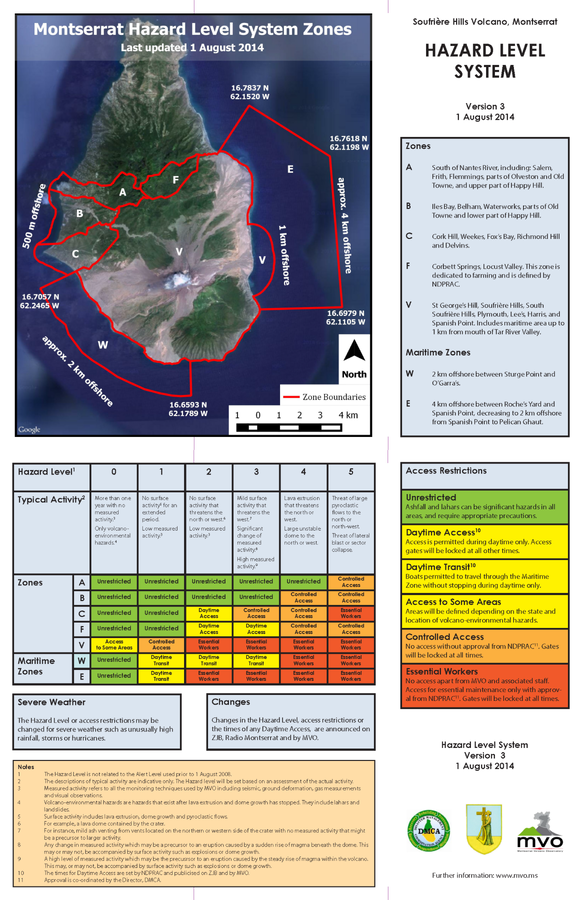
Soufriere Hills Volcano, Monsterrat. Hazards Level System. Version 3, 1 August 2014
Montserrat Volcano Observatory (MVO). (2014). Soufrière Hills Volcano, Monsterrat. Hazard Level System. Version 3, 1 August 2014. http://www.mvo.ms/pub/Hazard_Level_System/HLS-20140801.pdf
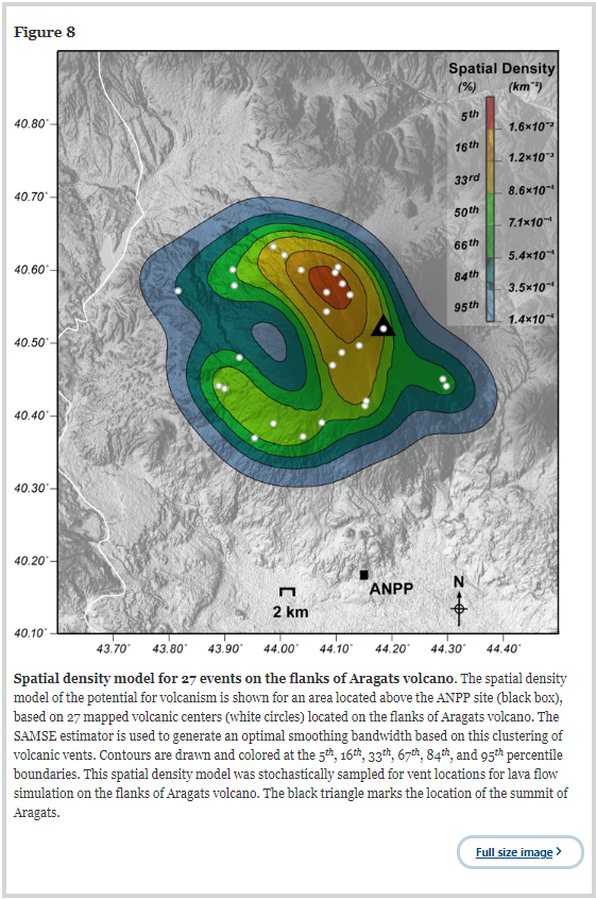
Figure in a journal article
Spatial density model for 27 events on the flanks of Aragats volcano
Figure 8 in: Connor, L.J., Connor, C.B., Meliksetian, K., Savov, I. (2012). Probabilistic approach to modeling lava flow inundation: a lava flow hazard assessment for a nuclear facility in Armenia. Journal of Applied Volcanology 1, 3. https://doi.org/10.1186/2191-5040-1-3
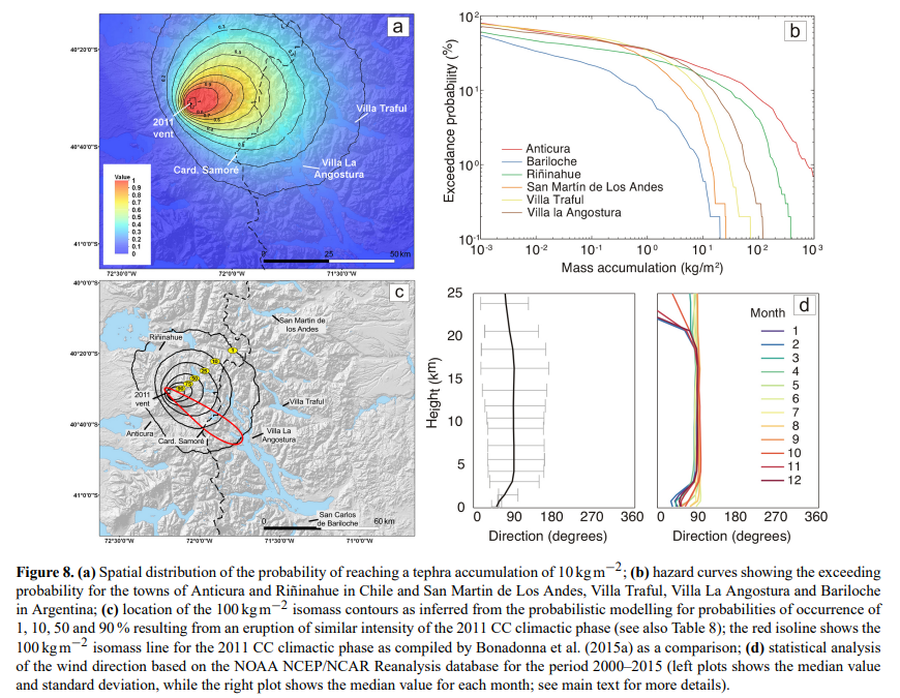
Figure in a journal article
Spatial distribution of the probability of reaching a tephra accumulation of 10 kg m−2
Figure 8 in: Elissondo, M., Baumann, V., Bonadonna, C., Pistolesi, M., Cioni, R., Bertagnini, A., Biass, S., Herrero, J.-C., & Gonzalez, R. (2016). Chronology and impact of the 2011 Cordón Caulle eruption, Chile. Natural Hazards and Earth System Sciences, 16(3), 675-704. https://doi.org/10.5194/nhess-16-675-2016, 2016
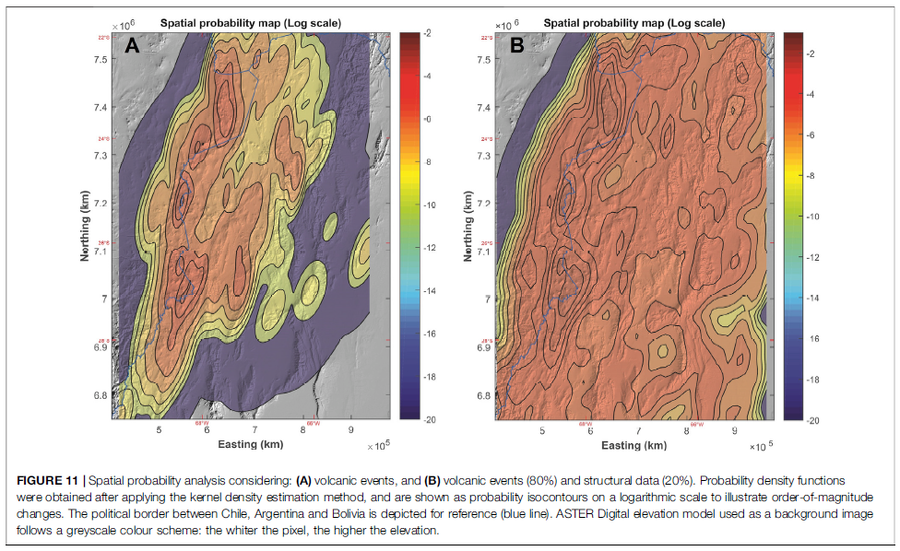
Figure in a journal article
Spatial probability analysis considering: (A) volcanic events, and (B) volcanic events (80%) and structural data (20%)
Figure 11 in: Bertin, D., Lindsay, J.M., Cronin, S.J., de Silva, S.L., Connor, C.B., Caffe, P.J., Grosse, P., Báez, W., Bustos, E., & Constantinescu, R. (2022). Probabilistic Volcanic Hazard Assessment of the 22.5–28° S Segment of the Central Volcanic Zone of the Andes. Frontiers in Earth Science, 10. https://doi.org/10.3389/feart.2022.875439
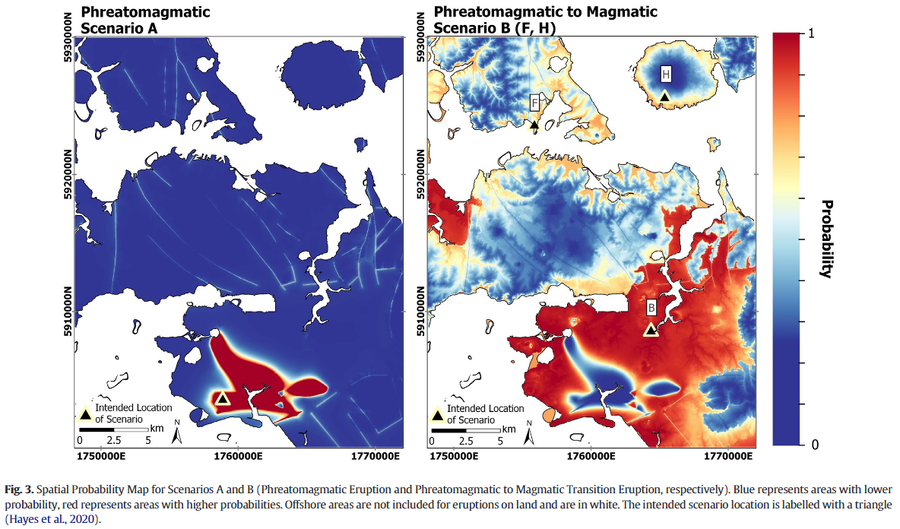
Figure in a journal article
Spatial Probability Map for Scenarios A and B (Phreatomagmatic Eruption and Phreatomagmatic to Magmatic Transition Eruption, respectively)
Figure 3 in: Ang, P. S., Bebbington, M. S., Lindsay, J. M., & Jenkins, S. F. (2020). From eruption scenarios to probabilistic volcanic hazard analysis: An example of the Auckland Volcanic Field, New Zealand. Journal of Volcanology and Geothermal Research, 397, 106871. https://doi.org/10.1016/j.jvolgeores.2020.106871
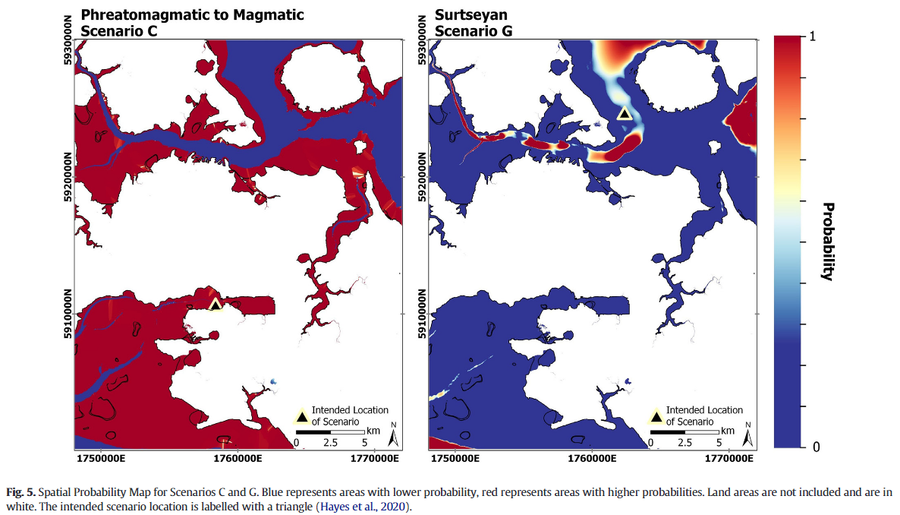
Figure in a journal article
Spatial Probability Map for Scenarios C and G.
Figure 5 in: Ang, P. S., Bebbington, M. S., Lindsay, J. M., & Jenkins, S. F. (2020). From eruption scenarios to probabilistic volcanic hazard analysis: An example of the Auckland Volcanic Field, New Zealand. Journal of Volcanology and Geothermal Research, 397, 106871. https://doi.org/10.1016/j.jvolgeores.2020.106871
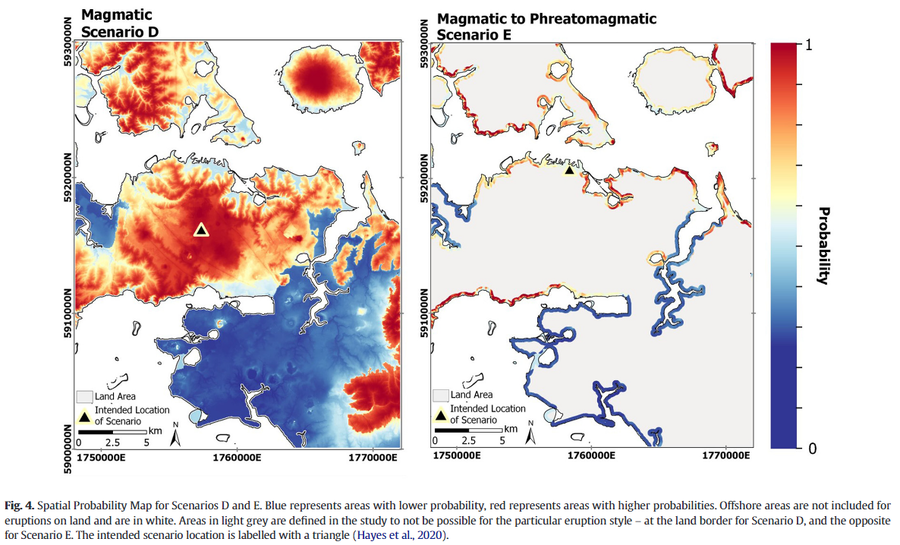
Figure in a journal article
Spatial Probability Map for Scenarios D and E.
Figure 4 in: Ang, P. S., Bebbington, M. S., Lindsay, J. M., & Jenkins, S. F. (2020). From eruption scenarios to probabilistic volcanic hazard analysis: An example of the Auckland Volcanic Field, New Zealand. Journal of Volcanology and Geothermal Research, 397, 106871. https://doi.org/10.1016/j.jvolgeores.2020.106871
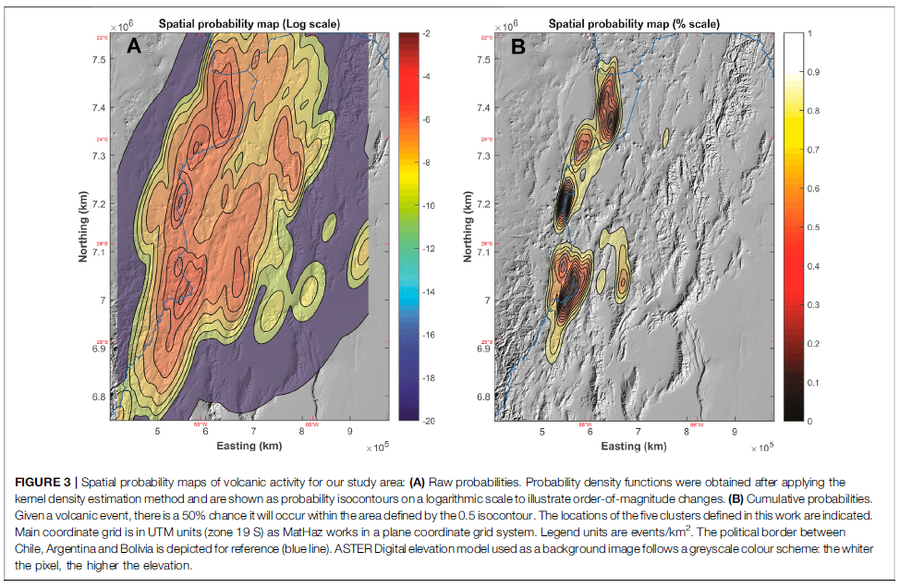
Figure in a journal article
Spatial probability maps of volcanic activity for our study area
Figure 3 in: Bertin, D., Lindsay, J.M., Cronin, S.J., de Silva, S.L., Connor, C.B., Caffe, P.J., Grosse, P., Báez, W., Bustos, E., & Constantinescu, R. (2022). Probabilistic Volcanic Hazard Assessment of the 22.5–28° S Segment of the Central Volcanic Zone of the Andes. Frontiers in Earth Science, 10. https://doi.org/10.3389/feart.2022.875439