
Advanced Search for Maps
Showing 291-300 of 2217
Official, Figure in hazard assessment
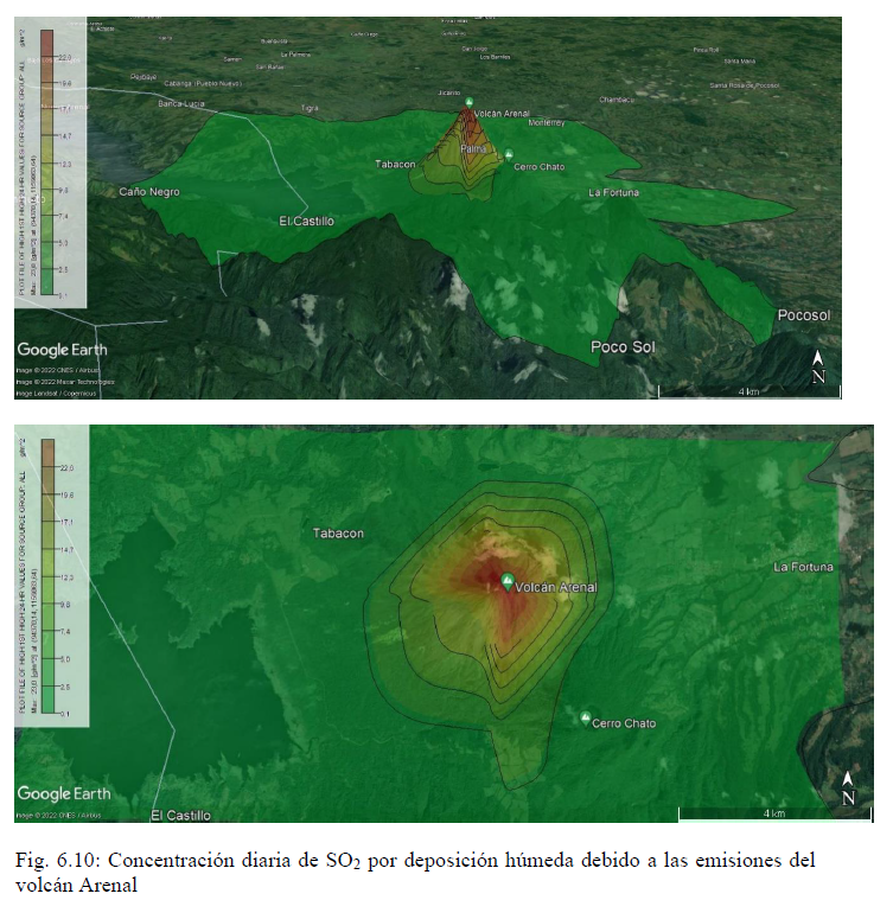
Concentración diaria de SO2 por deposición húmeda debido a las emisiones del volcán Arenal
(Daily SO2 concentration due to wet deposition of emissions from the Arenal volcano)
Figure 6.10 in: Alvarado, G.E., Brenes-André, F., Núñez, D., Borbón, J., Ramírez, M.A., Alpízar, Y., Núñez, S., Sibaja, J.P., Esquivel, L. (2023). Actualización del Análisis del Peligro Volcánico del Arenal, Costa Rica. Instituto Costarricense de Electricidad (ICE). Mayo 2023.
Official, Figure in hazard assessment
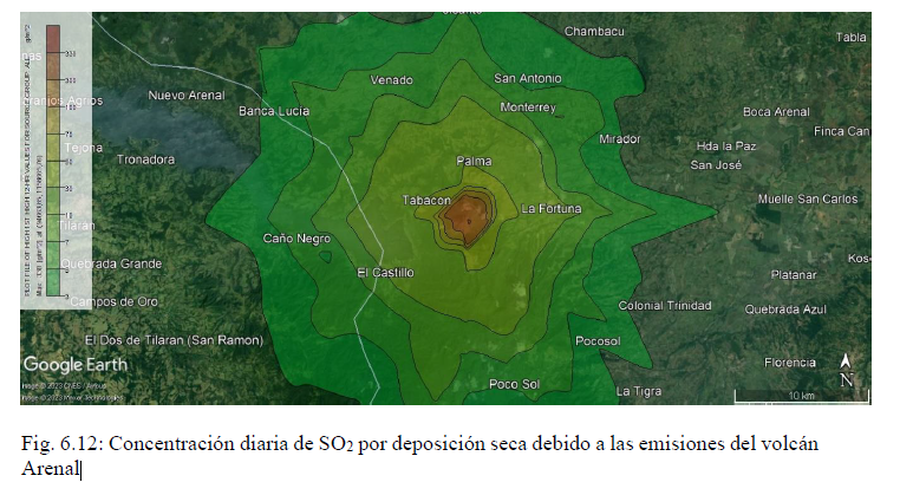
Concentración diaria de SO2 por deposición húmeda debido a las emisiones del volcán Arenal
(Daily SO2 concentration due to wet deposition of emissions from the Arenal volcano)
Figure 6.12 in: Alvarado, G.E., Brenes-André, F., Núñez, D., Borbón, J., Ramírez, M.A., Alpízar, Y., Núñez, S., Sibaja, J.P., Esquivel, L. (2023). Actualización del Análisis del Peligro Volcánico del Arenal, Costa Rica. Instituto Costarricense de Electricidad (ICE). Mayo 2023.
Official, Figure in a journal article
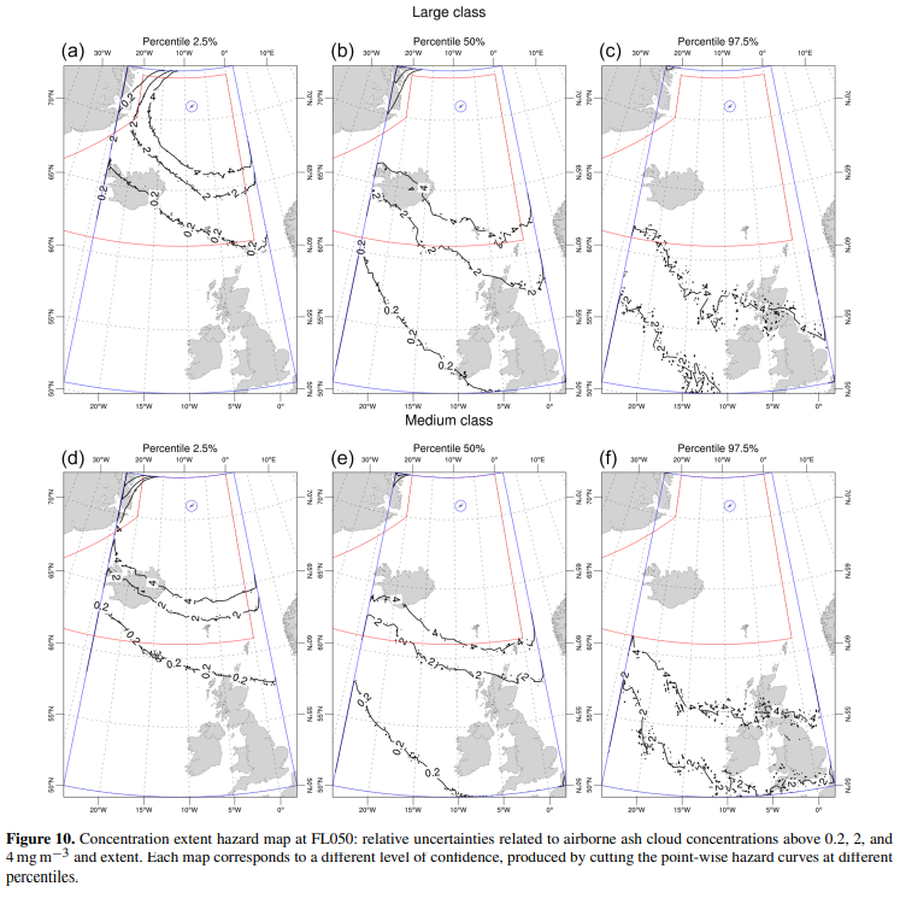
Concentration extent hazard map at FL050
Figure 10 in: Titos, M., Martínez Montesinos, B., Barsotti, S., Sandri, L., Folch, A., Mingari, L., Macedonio, G. & Costa, A. (2022). Long-term hazard assessment of explosive eruptions at Jan Mayen (Norway) and implications for air traffic in the North Atlantic. Natural Hazards and Earth System Sciences, 22(1), 139-163. https://doi.org/10.5194/nhess-22-139-2022
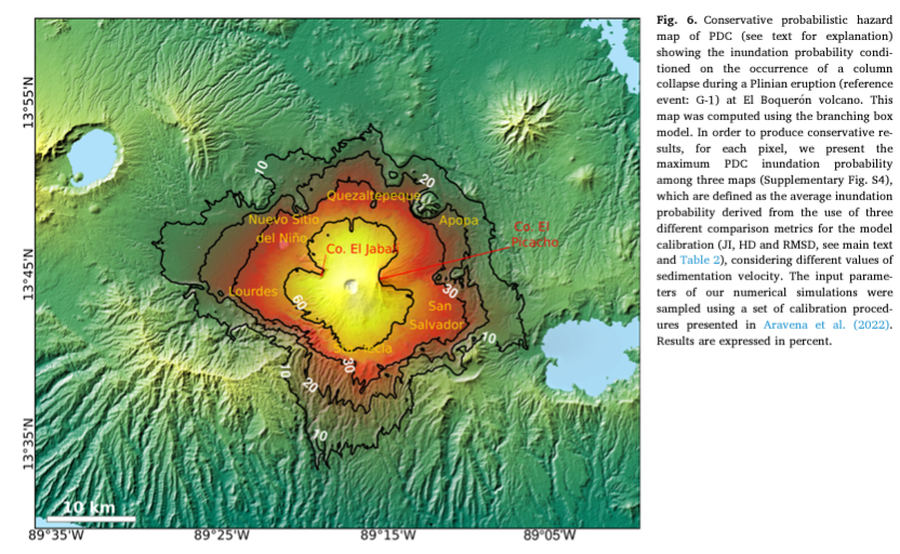
Figure in a journal article
Conservative probabilistic hazard map of PDC (see text for explanation) showing the inundation probability conditioned on the occurrence of a column collapse during a Plinian eruption (reference event: G-1) at El Boquerón volcano
Figure 6 in: Aravena, A., Bevilacqua, A., Neri, A., Gabellini, P., Ferrés, D., Escobar, D., Aiuppa, A., & Cioni, R. (2023). Scenario-based probabilistic hazard assessment for explosive events at the San Salvador Volcanic complex, El Salvador. Journal of Volcanology and Geothermal Research, 438, 107809.
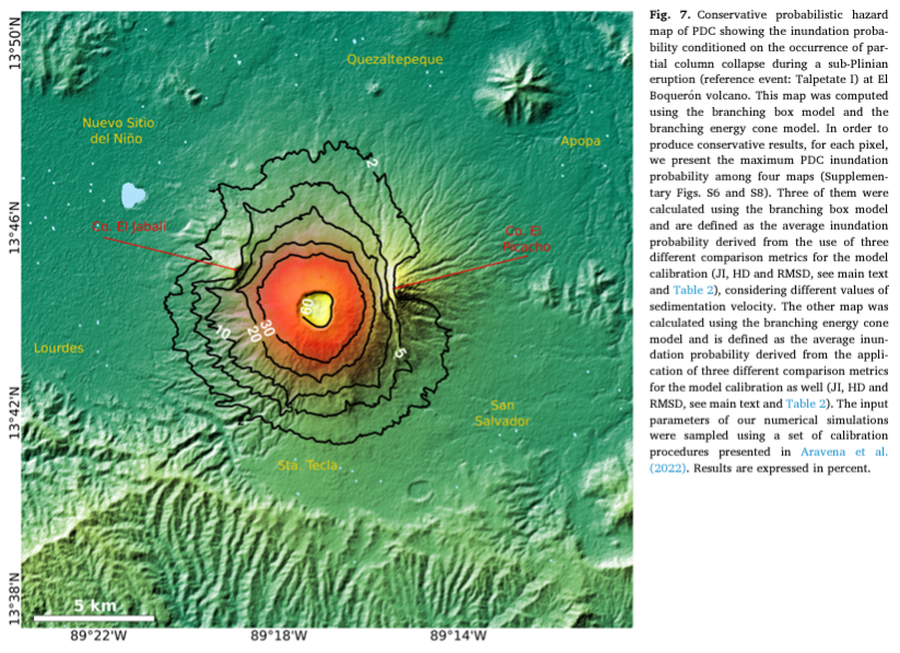
Figure in a journal article
Conservative probabilistic hazard map of PDC showing the inundation probability conditioned on the occurrence of partial column collapse during a sub-Plinian eruption (reference event: Talpetate I) at El Boquerón volcano
Figure 7 in: Aravena, A., Bevilacqua, A., Neri, A., Gabellini, P., Ferrés, D., Escobar, D., Aiuppa, A., & Cioni, R. (2023). Scenario-based probabilistic hazard assessment for explosive events at the San Salvador Volcanic complex, El Salvador. Journal of Volcanology and Geothermal Research, 438, 107809.
Official, Insert/poster-size map with accompanying report
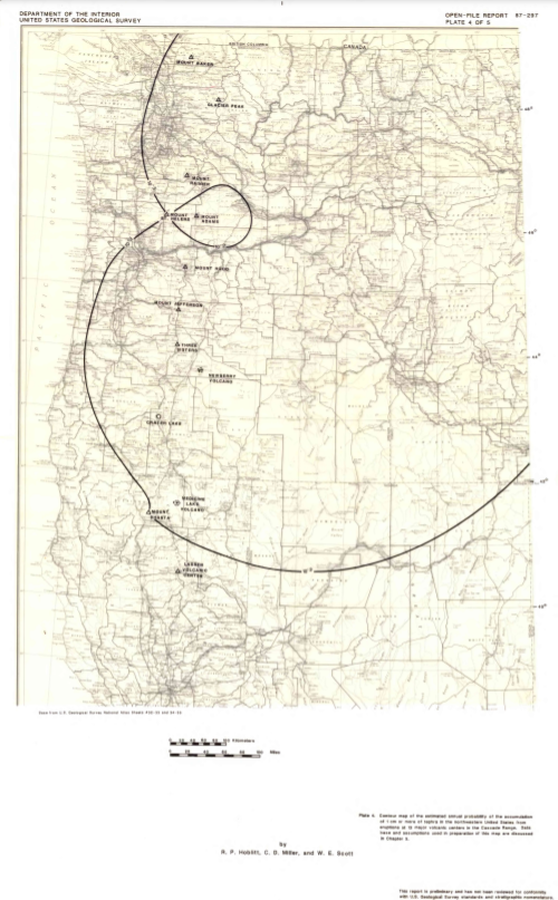
Contour map of the estimated annual probability of the accumulation of 1 cm or more of tephra in the northwestern United States at eruptions at 13 major volcanic centers in the Cascades Range
Plate 4 in: Hoblitt, R. P., Miller, C. D., & Scott, W. E. (1987). Volcanic hazards with regard to siting nuclear-power plants in the Pacific Northwest. U.S. Geological Survey, Open-File Report 87-297. https://doi.org/10.3133/ofr87297
Official, Insert/poster-size map with accompanying report
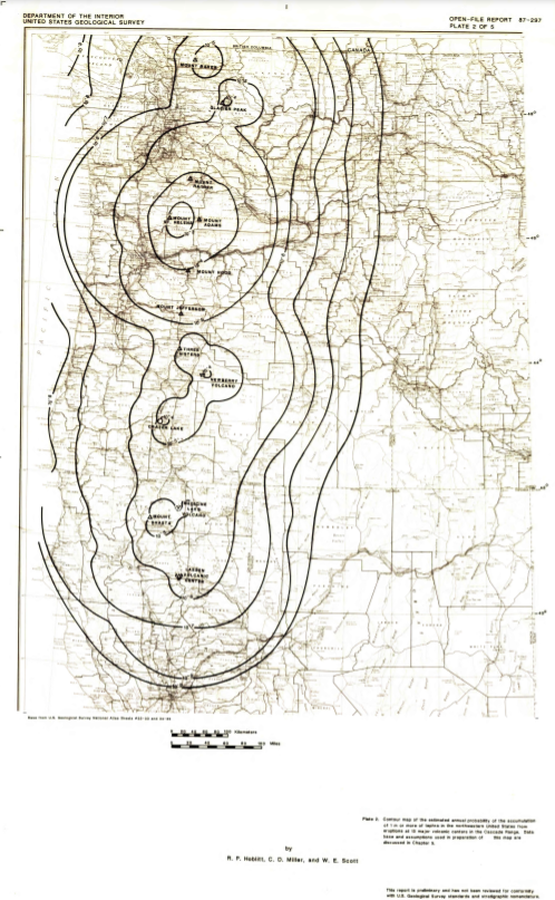
Contour map of the estimated annual probability of the accumulation of 1 m or more of tephra in the northwestern United States at eruptions at 13 major volcanic centers in the Cascades Range
Plate 2 in: Hoblitt, R. P., Miller, C. D., & Scott, W. E. (1987). Volcanic hazards with regard to siting nuclear-power plants in the Pacific Northwest. U.S. Geological Survey, Open-File Report 87-297. https://doi.org/10.3133/ofr87297
Official, Insert/poster-size map with accompanying report
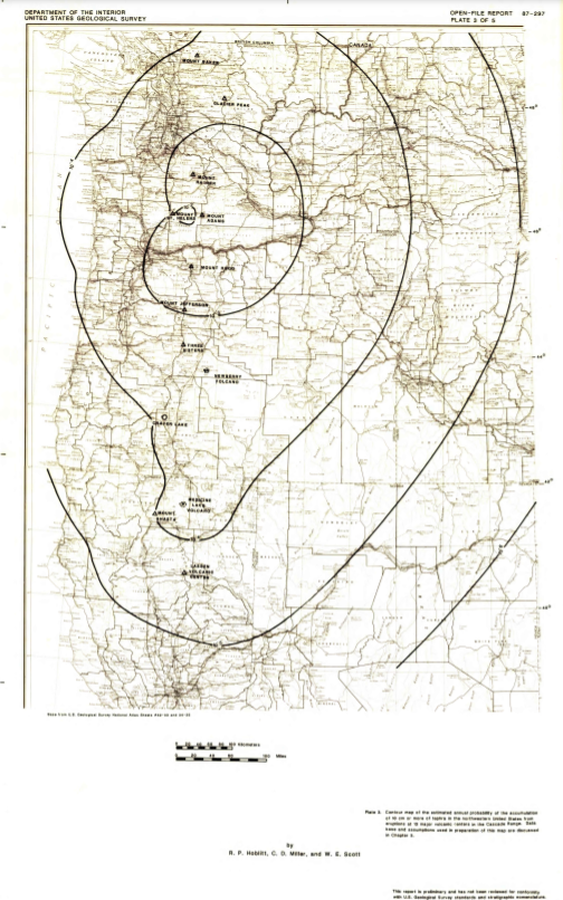
Contour map of the estimated annual probability of the accumulation of 10 cm or more of tephra in the northwestern United States at eruptions at 13 major volcanic centers in the Cascades Range
Plate 3 in: Hoblitt, R. P., Miller, C. D., & Scott, W. E. (1987). Volcanic hazards with regard to siting nuclear-power plants in the Pacific Northwest. U.S. Geological Survey, Open-File Report 87-297. https://doi.org/10.3133/ofr87297
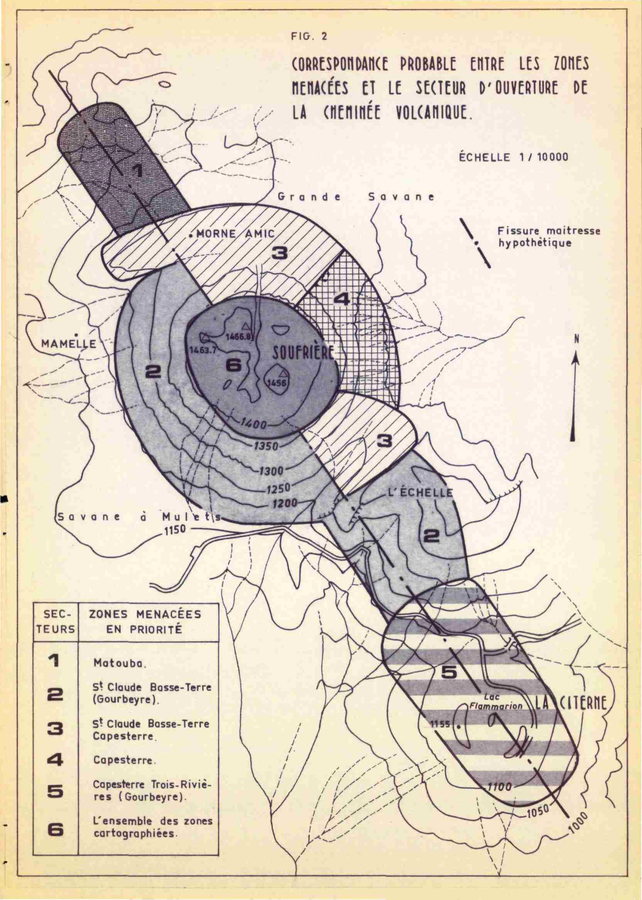
Official, Figure in hazard assessment
Correspondance Probable Entre les Zones Menacées et le Secteur d'Ouverture de la Cheminée Volcanique
(Probable Correspondence Between the Endangered Zones and the Opening Sector of the Volcanic Chimney)
Figure 2 in: Westercamp, D. (1976). Dynamismes Éruptifs et Zonation des Risques Volcaniques a la Sourfrière de Guadeloupe. Bureau de Recherches Géologiques, Service Geologique des Antilles.
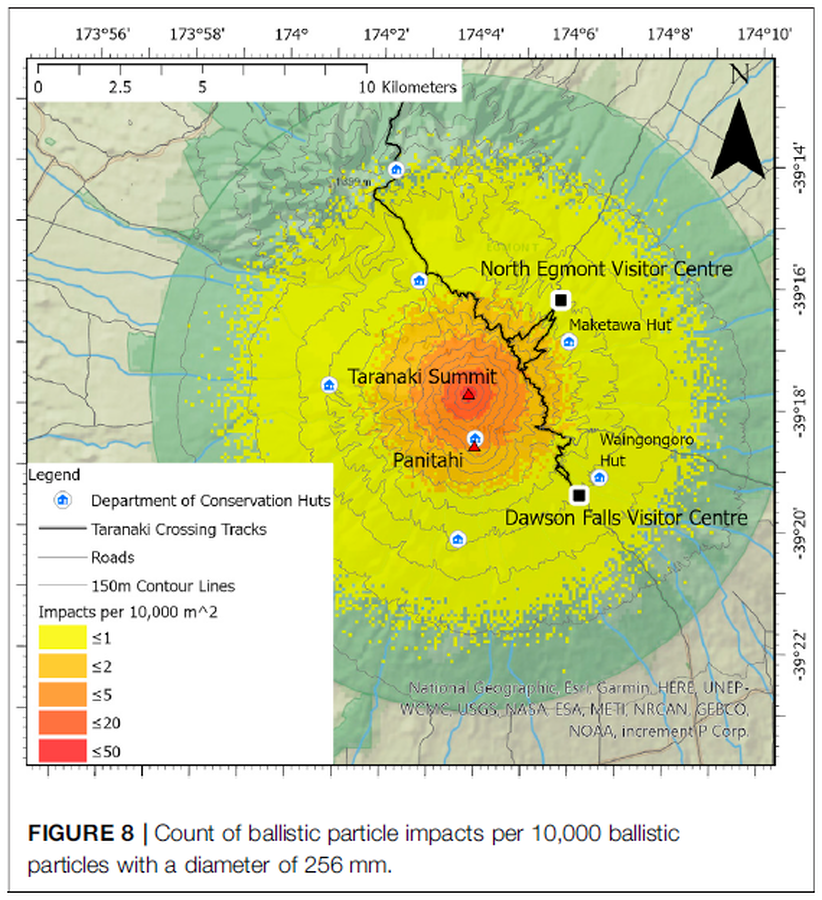
Figure in a journal article
Count of ballistic particle impacts per 10,000 ballistic particles with a diameter of 256 mm
Figure 8 in: Mead, S., Procter, J., Bebbington, M., & Rodriguez-Gomez, C. (2022). Probabilistic Volcanic Hazard Assessment for National Park Infrastructure Proximal to Taranaki Volcano (New Zealand). Frontiers in Earth Science, 435. https://doi.org/10.3389/feart.2022.832531