
Advanced Search for Maps
Showing 1-9 of 9
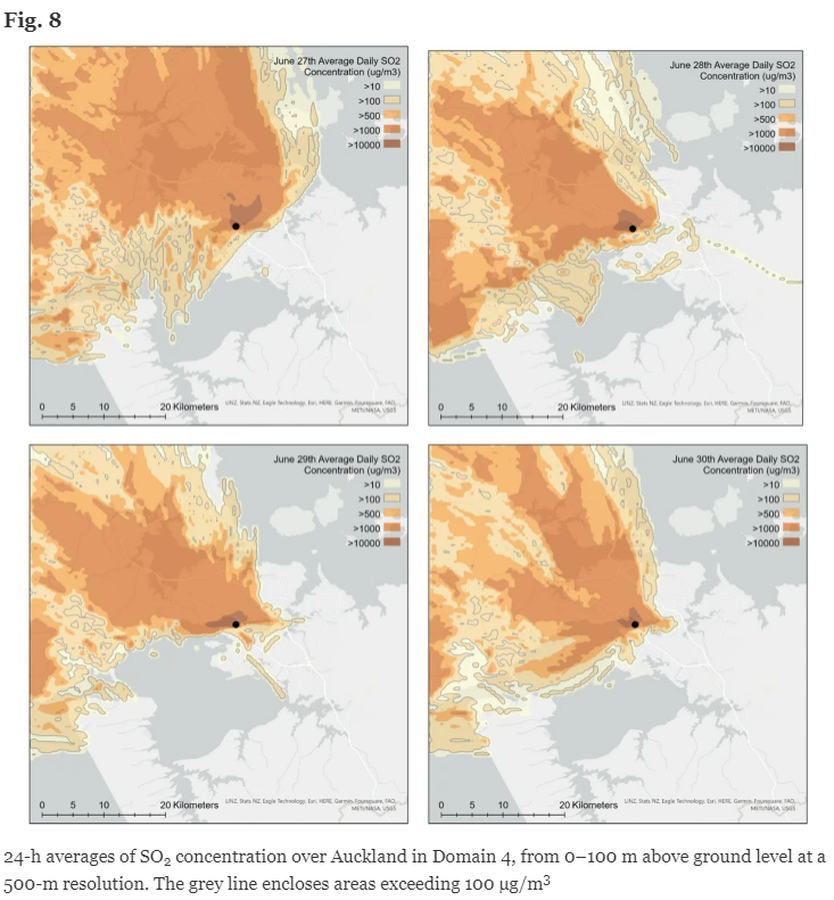
Figure in a journal article
24-h averages of SO2 concentration over Auckland in Domain 4, from 0–100 m above ground level at a 500-m resolution
Figure 8 in: Brody-Heine, S., Katurji, M., Stewart, C., Wilson, T., Smid, E. R., & Trancoso, R. (2024). Modeling SO2 dispersion from future eruptions in the Auckland Volcanic Field, New Zealand. Journal of Applied Volcanology, 13(1), 1-18.
Official, Interactive web-based map
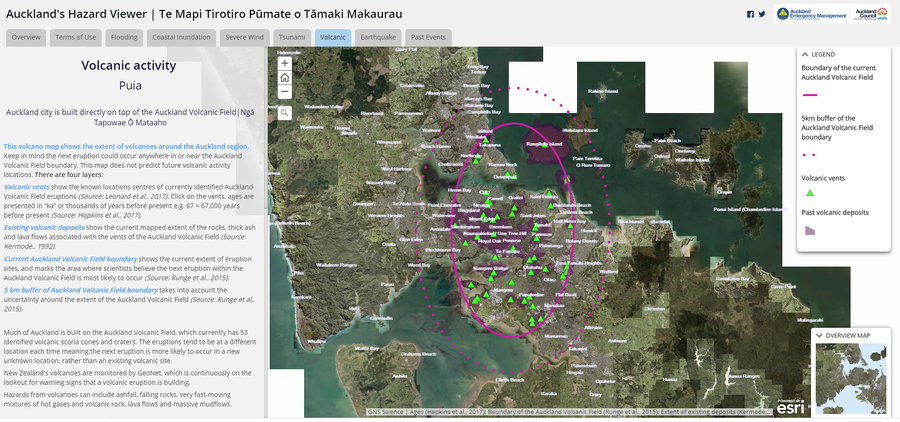
Auckland's Hazard Viewer Volcanic Activity
Auckland Council. Auckland's Hazard Viewer: Volcanic Activity.
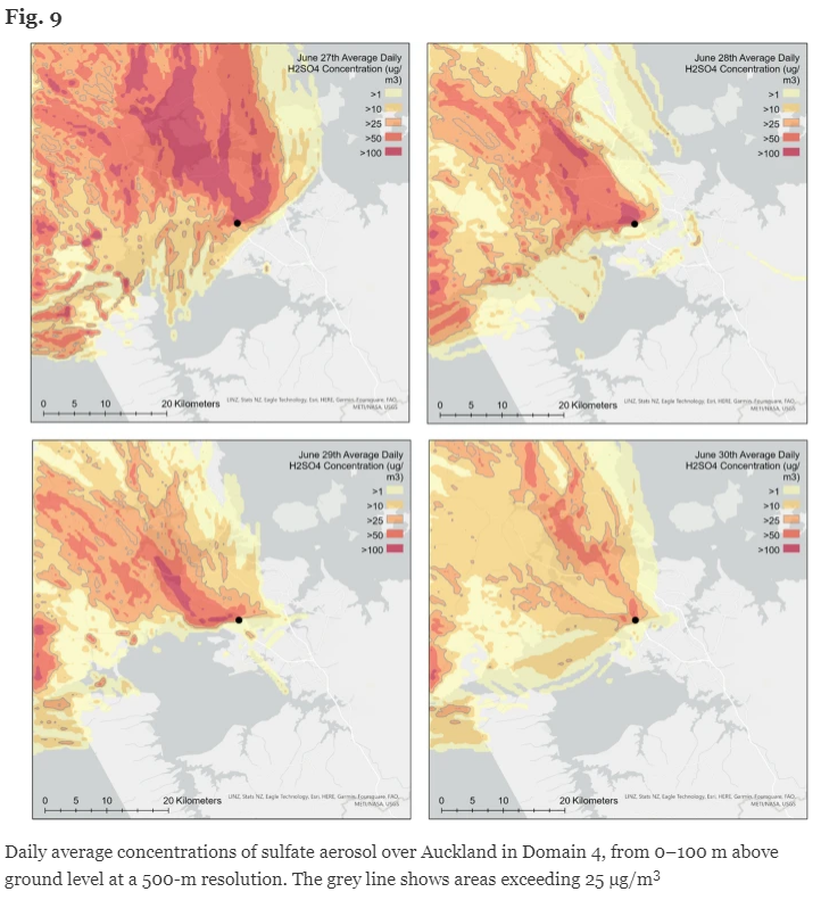
Figure in a journal article
Daily average concentrations of sulfate aerosol over Auckland in Domain 4, from 0–100 m above ground level at a 500-m resolution
Figure 9 in: Brody-Heine, S., Katurji, M., Stewart, C., Wilson, T., Smid, E. R., & Trancoso, R. (2024). Modeling SO2 dispersion from future eruptions in the Auckland Volcanic Field, New Zealand. Journal of Applied Volcanology, 13(1), 1-18.
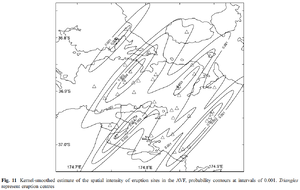
Figure in a journal article
Kernel-smoothed estimate of the spatial intensity of eruption sites in the AVF
Figure 11 in: Bebbington, M.S. & Cronin, S.J. (2011). Spatio-temporal hazard estimation in the Auckland Volcanic Field, New Zealand, with a new event-order model. Bulletin of Volcanology, 73(1), 55-72. https://doi.org/10.1007/s00445-010-0403-6
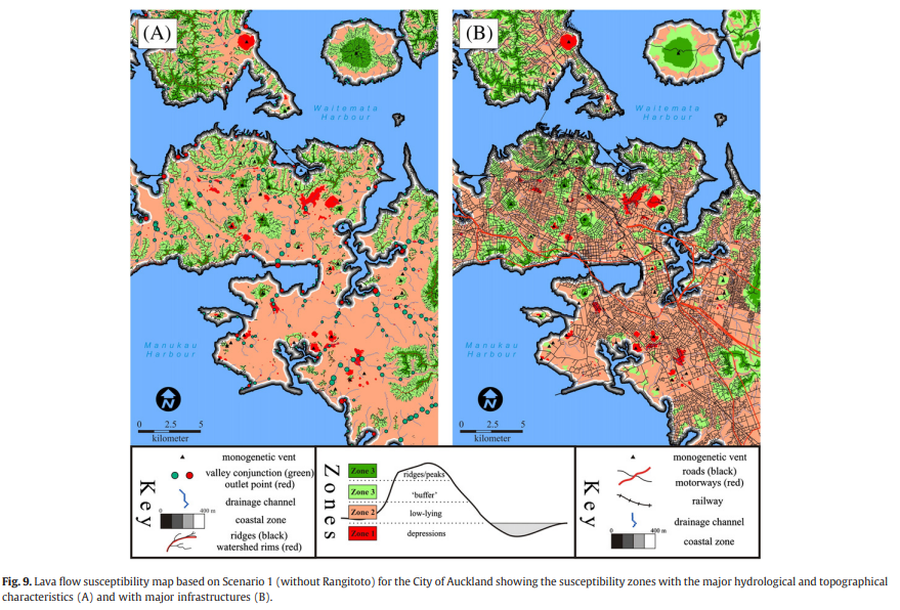
Figure in a journal article
Lava flow susceptibility map based on Scenario 1 (without Rangitoto) for the City of Auckland showing the susceptibility zones with the major hydrological and topographical characteristics and with major infrastructures
Figure 9 in: Kereszturi, G., Procter, J., Cronin, S. J., Németh, K., Bebbington, M., & Lindsay, J. (2012). LiDAR-based quantification of lava flow susceptibility in the City of Auckland (New Zealand). Remote Sensing of Environment, 125, 198-213. https://doi.org/10.1016/j.rse.2012.07.015
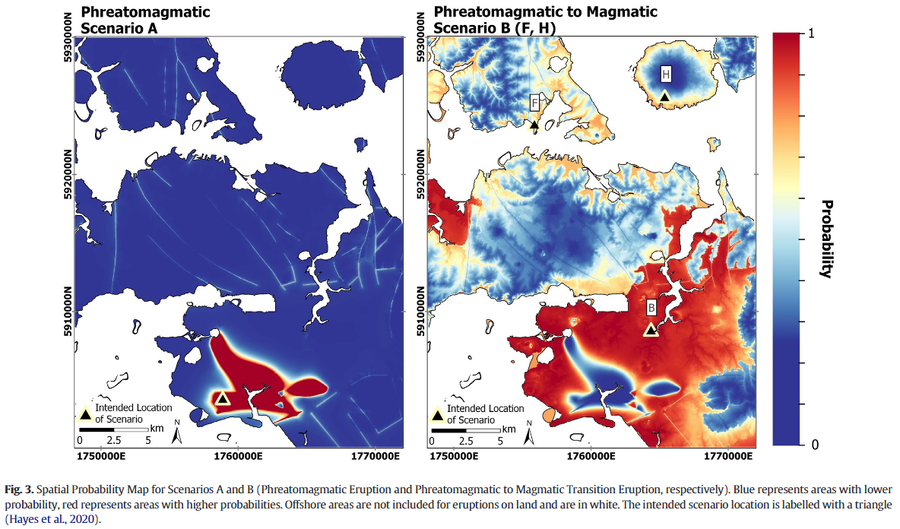
Figure in a journal article
Spatial Probability Map for Scenarios A and B (Phreatomagmatic Eruption and Phreatomagmatic to Magmatic Transition Eruption, respectively)
Figure 3 in: Ang, P. S., Bebbington, M. S., Lindsay, J. M., & Jenkins, S. F. (2020). From eruption scenarios to probabilistic volcanic hazard analysis: An example of the Auckland Volcanic Field, New Zealand. Journal of Volcanology and Geothermal Research, 397, 106871. https://doi.org/10.1016/j.jvolgeores.2020.106871
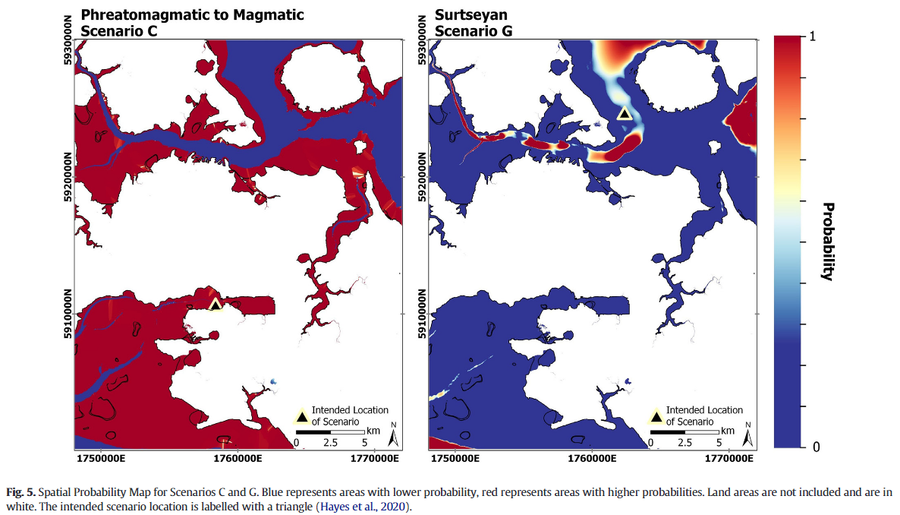
Figure in a journal article
Spatial Probability Map for Scenarios C and G.
Figure 5 in: Ang, P. S., Bebbington, M. S., Lindsay, J. M., & Jenkins, S. F. (2020). From eruption scenarios to probabilistic volcanic hazard analysis: An example of the Auckland Volcanic Field, New Zealand. Journal of Volcanology and Geothermal Research, 397, 106871. https://doi.org/10.1016/j.jvolgeores.2020.106871
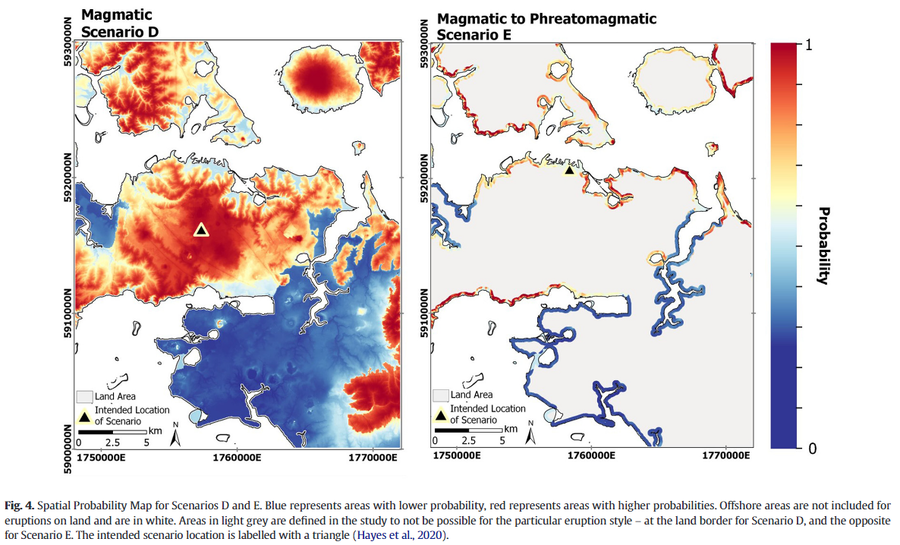
Figure in a journal article
Spatial Probability Map for Scenarios D and E.
Figure 4 in: Ang, P. S., Bebbington, M. S., Lindsay, J. M., & Jenkins, S. F. (2020). From eruption scenarios to probabilistic volcanic hazard analysis: An example of the Auckland Volcanic Field, New Zealand. Journal of Volcanology and Geothermal Research, 397, 106871. https://doi.org/10.1016/j.jvolgeores.2020.106871
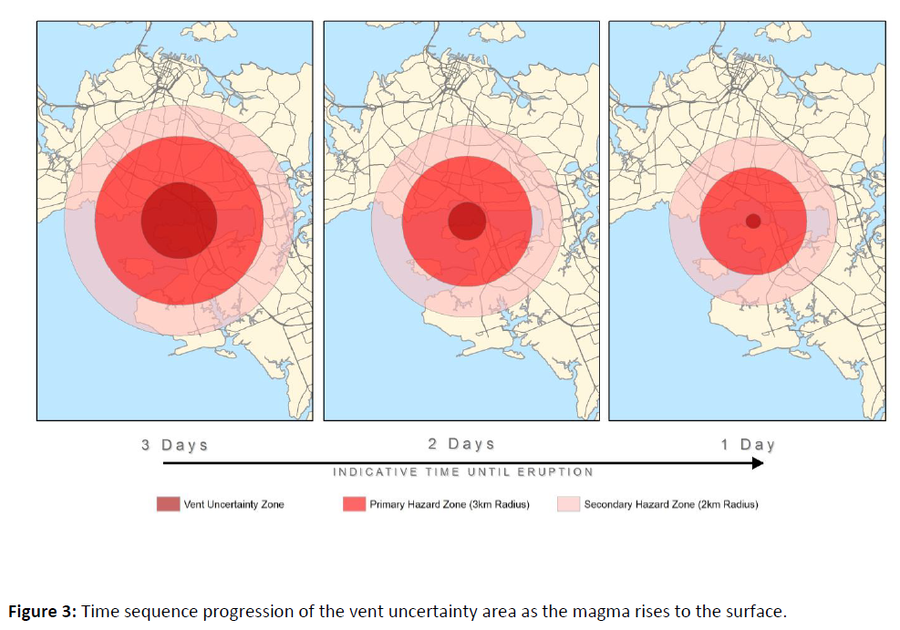
Official, Figure in hazard assessment
Time sequence progression of the vent uncertainty area as the magma rises to the surface
Figure 3 in: Auckland Council (2015). Auckland Volcanic Field Contingency Plan March 2015. Civil Defence and Emergency Management. Auckland. 50 p.