
Advanced Search for Maps
Showing 1-10 of 31
Official, Figure in hazard assessment
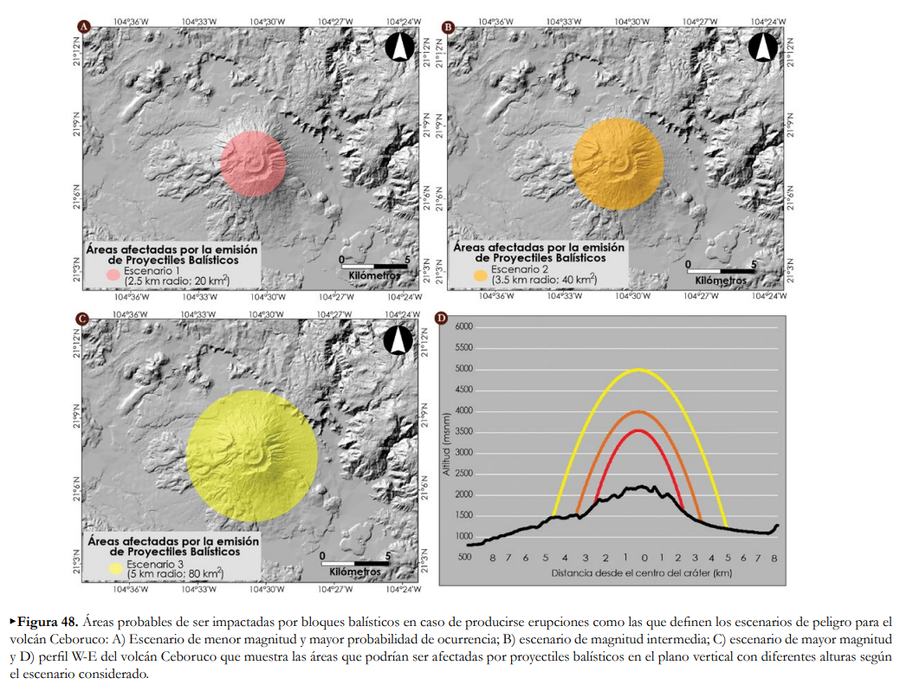
Áreas afectadas por la emisión de Proyectiles Balísticos
(Areas affected by the emission of Ballistic Projectiles)
Figure 48 in: Ferrés López, D., Sieron, K., González Zuccolotto, K., Constantinescu, R., Agustín Flores, J., Siebe Grabach, C., Capra Pedol, L., Connor, L., & Connor, C.B. (2019). Memoria técnica del mapa de peligros del volcán Ceboruco (Nayarit). Monografías del Instituto de Geofísica, 24.
Official, Figure in hazard assessment
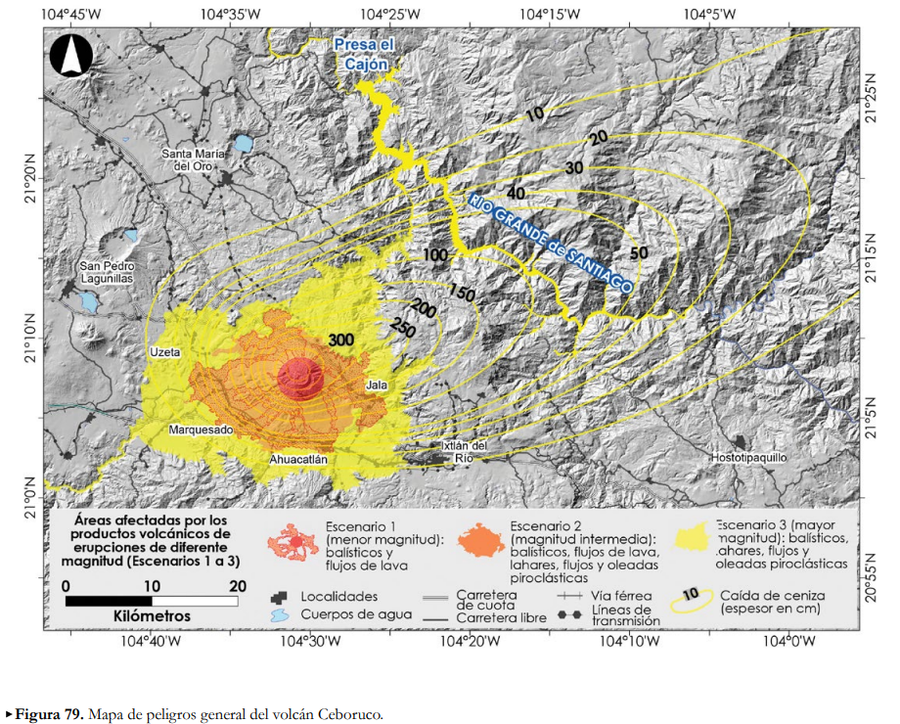
Áreas afectadas por los productos volcánicos de erupciones de diferente magntiud (Escenarios 1 a 3)
(Areas affected by the volcanic products of eruptions of different magnitudes (Scenarios 1 to 3))
Figure 79 in: Ferrés López, D., Sieron, K., González Zuccolotto, K., Constantinescu, R., Agustín Flores, J., Siebe Grabach, C., Capra Pedol, L., Connor, L., & Connor, C.B. (2019). Memoria técnica del mapa de peligros del volcán Ceboruco (Nayarit). Monografías del Instituto de Geofísica, 24.
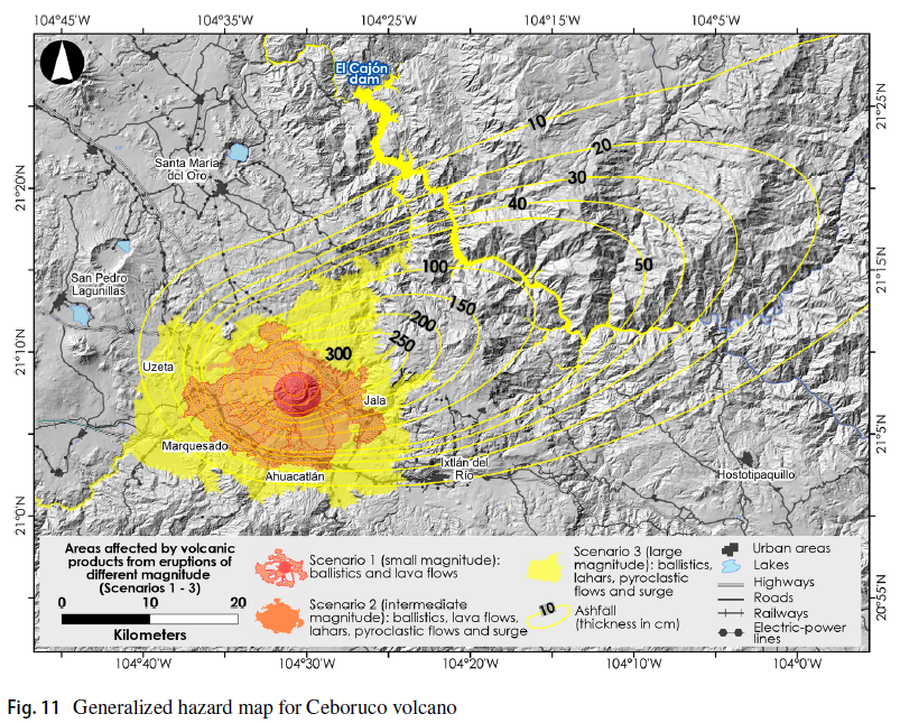
Figure in a journal article
Areas affected by volcanic products from eruptions of different magnitude (Scenarios 1-3)
Figure 11 in: Sieron, K., Ferrés, D., Siebe, C., Constantinescu, R., Capra, L., Connor, C., Connor, L., Groppelli, G. & Zuccolotto, K.G. (2019). Ceboruco hazard map: part II—modeling volcanic phenomena and construction of the general hazard map. Natural Hazards, 96(2), p. 893-933. https://doi.org/10.1007/s11069-019-03577-5
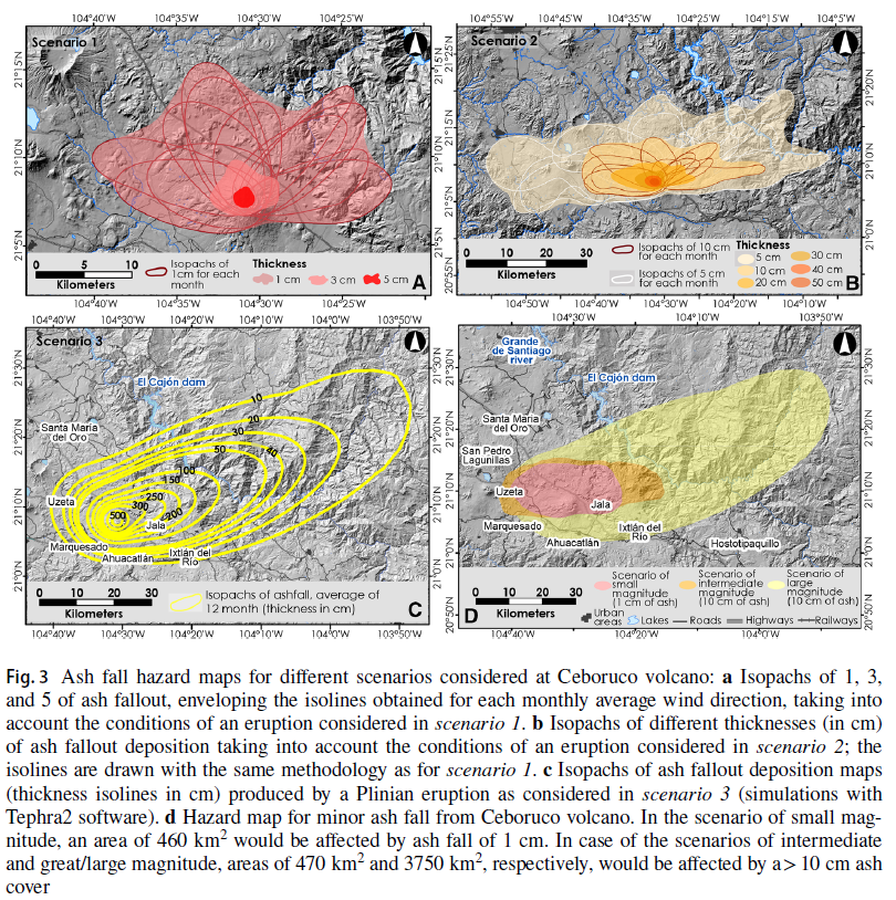
Figure in a journal article
Ash fall hazard maps for different scenarios considered at Ceboruco volcano
Figure 3 in: Sieron, K., Ferrés, D., Siebe, C., Constantinescu, R., Capra, L., Connor, C., Connor, L., Groppelli, G. & Zuccolotto, K.G. (2019). Ceboruco hazard map: part II—modeling volcanic phenomena and construction of the general hazard map. Natural Hazards, 96(2), p. 893-933. https://doi.org/10.1007/s11069-019-03577-5
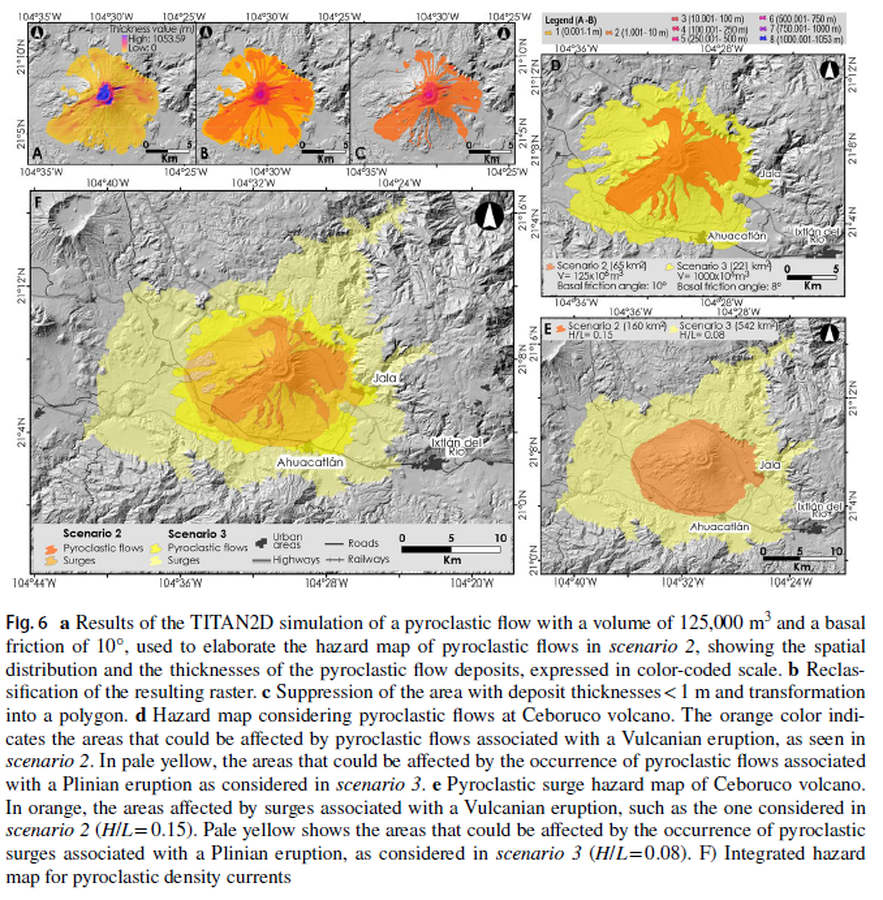
Figure in a journal article
Hazard map considering pyroclastic flows at Ceboruco volcano
Figure 6 in: Sieron, K., Ferrés, D., Siebe, C., Constantinescu, R., Capra, L., Connor, C., Connor, L., Groppelli, G. & Zuccolotto, K.G. (2019). Ceboruco hazard map: part II—modeling volcanic phenomena and construction of the general hazard map. Natural Hazards, 96(2), p. 893-933. https://doi.org/10.1007/s11069-019-03577-5
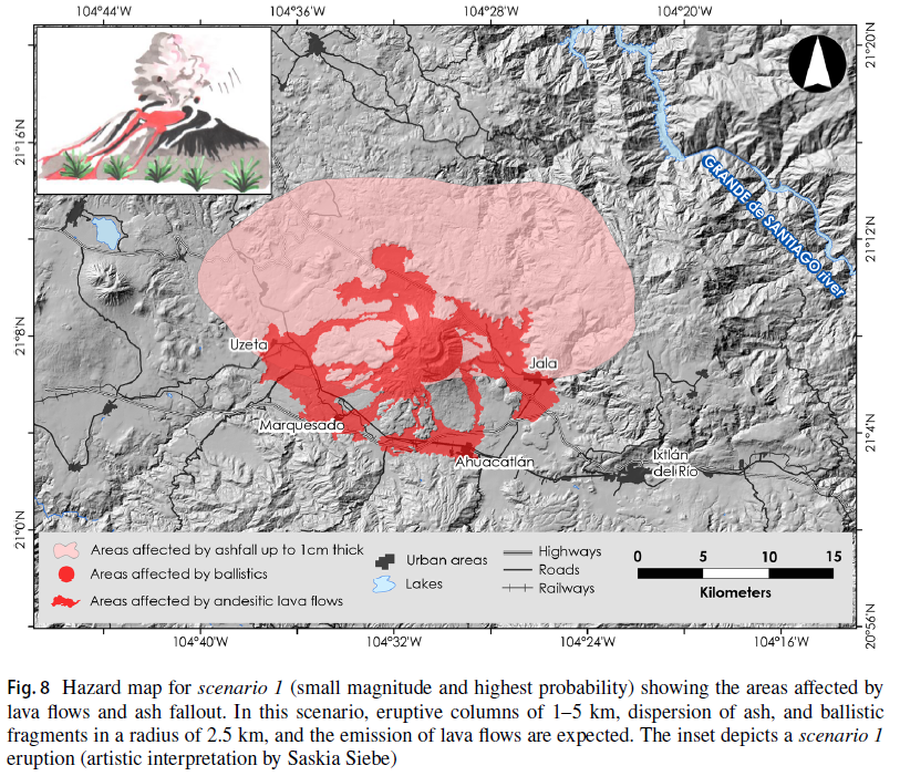
Figure in a journal article
Hazard map for scenario 1 (small magnitude and highest probability) showing the areas affected by lava flows and ash fallout
Figure 8 in: Sieron, K., Ferrés, D., Siebe, C., Constantinescu, R., Capra, L., Connor, C., Connor, L., Groppelli, G. & Zuccolotto, K.G. (2019). Ceboruco hazard map: part II—modeling volcanic phenomena and construction of the general hazard map. Natural Hazards, 96(2), p. 893-933. https://doi.org/10.1007/s11069-019-03577-5
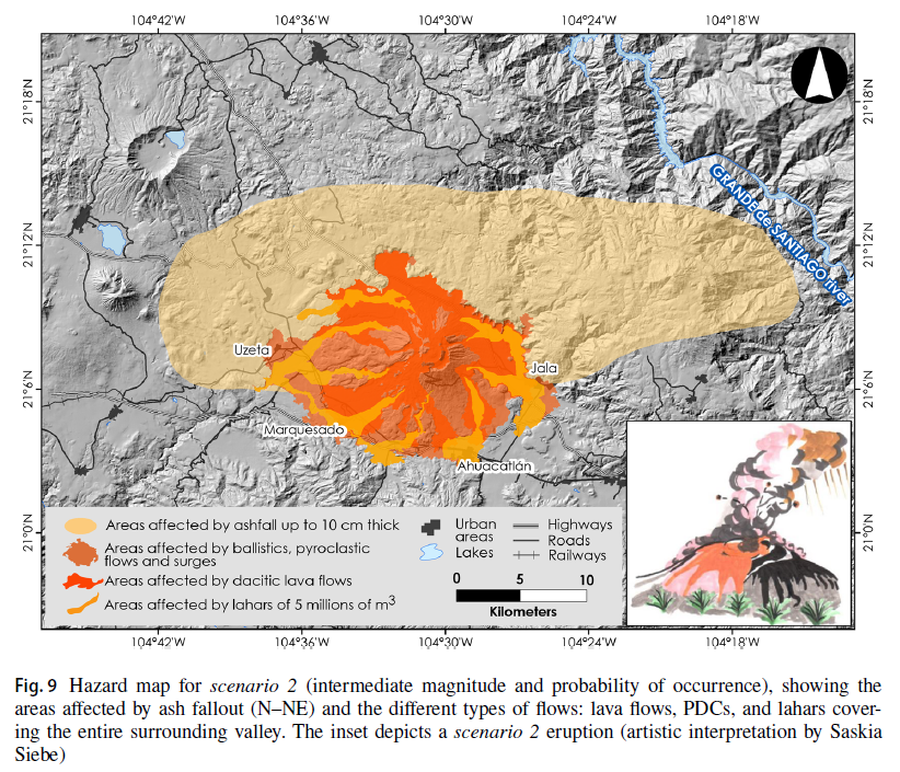
Figure in a journal article
Hazard map for scenario 2 (intermediate magnitude and probability of occurrence), showing the areas affected by ash fallout (N–NE) and the different types of flows: lava flows, PDCs, and lahars covering the entire surrounding valley
Figure 9 in: Sieron, K., Ferrés, D., Siebe, C., Constantinescu, R., Capra, L., Connor, C., Connor, L., Groppelli, G. & Zuccolotto, K.G. (2019). Ceboruco hazard map: part II—modeling volcanic phenomena and construction of the general hazard map. Natural Hazards, 96(2), p. 893-933. https://doi.org/10.1007/s11069-019-03577-5
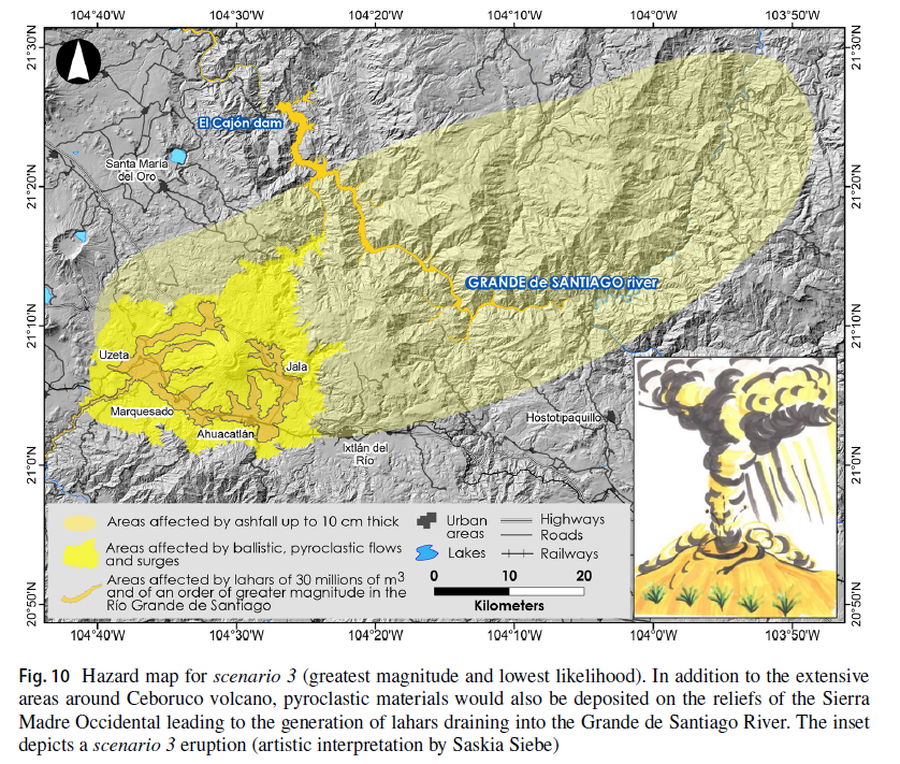
Figure in a journal article
Hazard map for scenario 3 (greatest magnitude and lowest likelihood)
Figure 10 in: Sieron, K., Ferrés, D., Siebe, C., Constantinescu, R., Capra, L., Connor, C., Connor, L., Groppelli, G. & Zuccolotto, K.G. (2019). Ceboruco hazard map: part II—modeling volcanic phenomena and construction of the general hazard map. Natural Hazards, 96(2), p. 893-933. https://doi.org/10.1007/s11069-019-03577-5
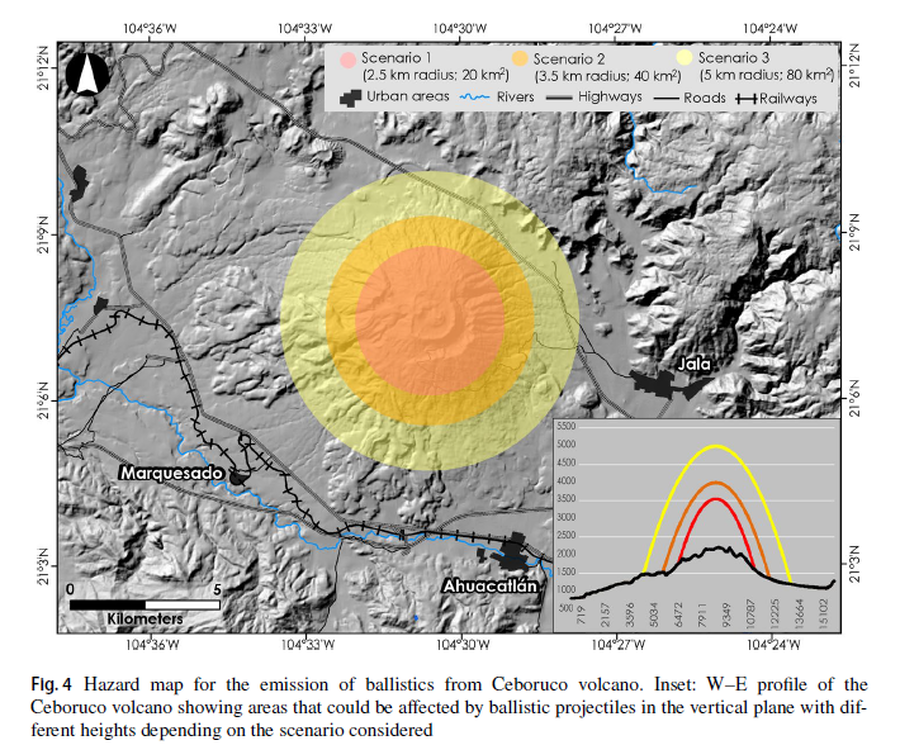
Figure in a journal article
Hazard map for the emission of ballistics from Ceboruco volcano
Figure 4 in: Sieron, K., Ferrés, D., Siebe, C., Constantinescu, R., Capra, L., Connor, C., Connor, L., Groppelli, G. & Zuccolotto, K.G. (2019). Ceboruco hazard map: part II—modeling volcanic phenomena and construction of the general hazard map. Natural Hazards, 96(2), p. 893-933. https://doi.org/10.1007/s11069-019-03577-5
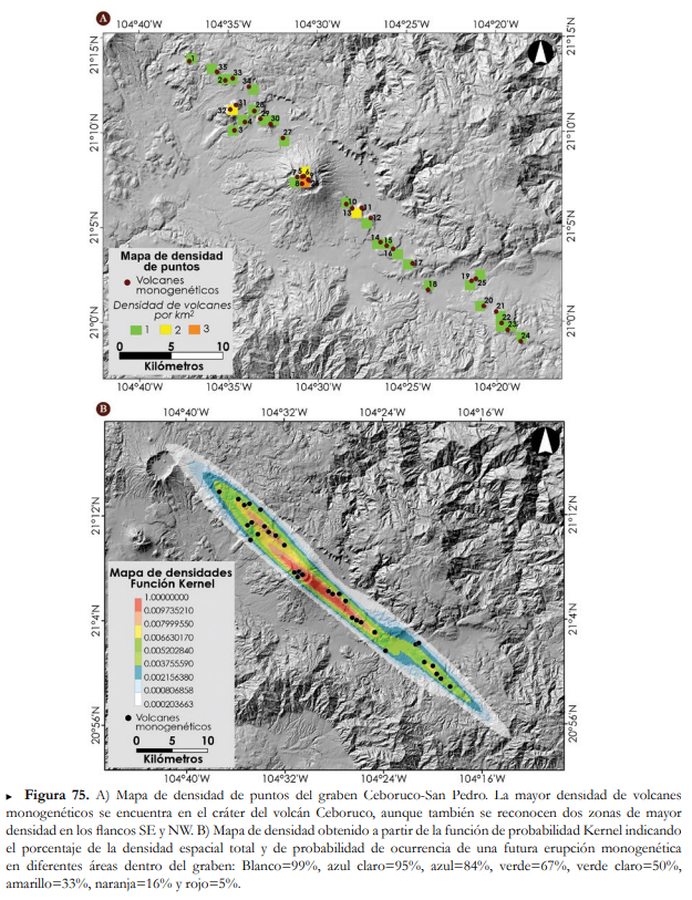
Official, Figure in hazard assessment
Mapa de densidad de puntos; Mapa de densidades Función Kernel
(Point density map; Kernel Density Function map)
Figure 75 in: Ferrés López, D., Sieron, K., González Zuccolotto, K., Constantinescu, R., Agustín Flores, J., Siebe Grabach, C., Capra Pedol, L., Connor, L., & Connor, C.B. (2019). Memoria técnica del mapa de peligros del volcán Ceboruco (Nayarit). Monografías del Instituto de Geofísica, 24.