
Advanced Search for Maps
Showing 1-5 of 5
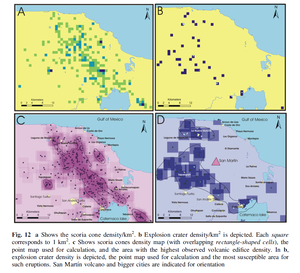
Figure in a journal article
Fig. 12 a Shows the scoria cone density/km². b Explosion crater density/km² is depicted. Each square corresponds to 1 km2. c Shows scoria cones density map (with overlapping rectangle-shaped cells), the point map used for calculation, and the area with the highest observed volcanic edifice density.
Figure 12 in: Sieron, K., Capra, L., & Rodríguez-Elizararrás, S. (2014). Hazard assessment at San Martín volcano based on geological record, numerical modeling, and spatial analysis. Natural hazards, 70(1), 275-297. https://doi.org/10.1007/s11069-013-0807-7
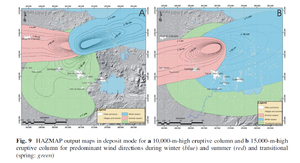
Figure in a journal article
HAZMAP output maps in deposit mode for a 10,000-m-high eruptive column and b 15,000-m-high eruptive column for predominant wind directions during winter (blue) and summer (red) and transitional (spring: green)
Figure 9 in: Sieron, K., Capra, L., & Rodríguez-Elizararrás, S. (2014). Hazard assessment at San Martín volcano based on geological record, numerical modeling, and spatial analysis. Natural hazards, 70(1), 275-297. https://doi.org/10.1007/s11069-013-0807-7
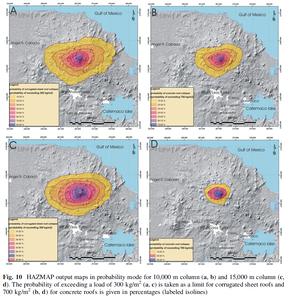
Figure in a journal article
HAZMAP output maps in probability mode for 10,000 m column (a, b) and 15,000 m column (c, d).
Figure 10 in: Sieron, K., Capra, L., & Rodríguez-Elizararrás, S. (2014). Hazard assessment at San Martín volcano based on geological record, numerical modeling, and spatial analysis. Natural hazards, 70(1), 275-297. https://doi.org/10.1007/s11069-013-0807-7
Official, Map sheet or poster
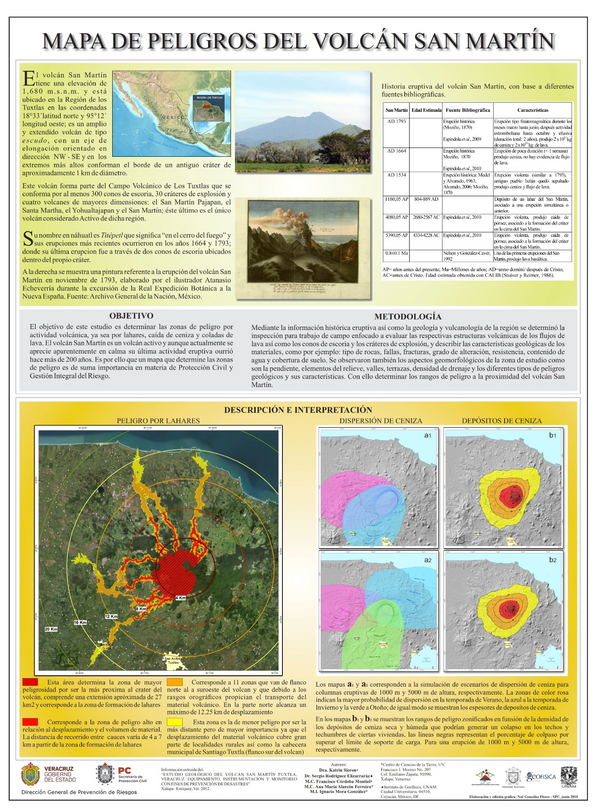
Mapa de Peligros del Volcán San Martín
(San Martín Volcano Hazard Map)
Sieron, K., Rodríguez Elizarraráz, S., Córdoba Montiel, F., Alarcón Ferreira, A.M., & Mora González, I. (2018). Mapa de Peligros del Volcán San Martín. Centro de Ciencias de la Tierra, UV & Instituto de Geofísica, UNAM
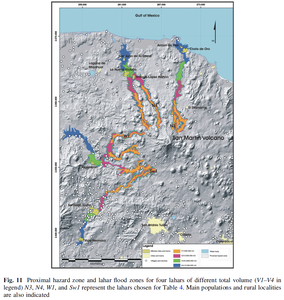
Figure in a journal article
Proximal hazard zone and lahar flood zones for four lahars of different total volume
Figure 11 in: Sieron, K., Capra, L., & Rodríguez-Elizararrás, S. (2014). Hazard assessment at San Martín volcano based on geological record, numerical modeling, and spatial analysis. Natural hazards, 70(1), 275-297. https://doi.org/10.1007/s11069-013-0807-7