
Advanced Search for Maps
Showing 1-10 of 32
Official, Map in an information statement
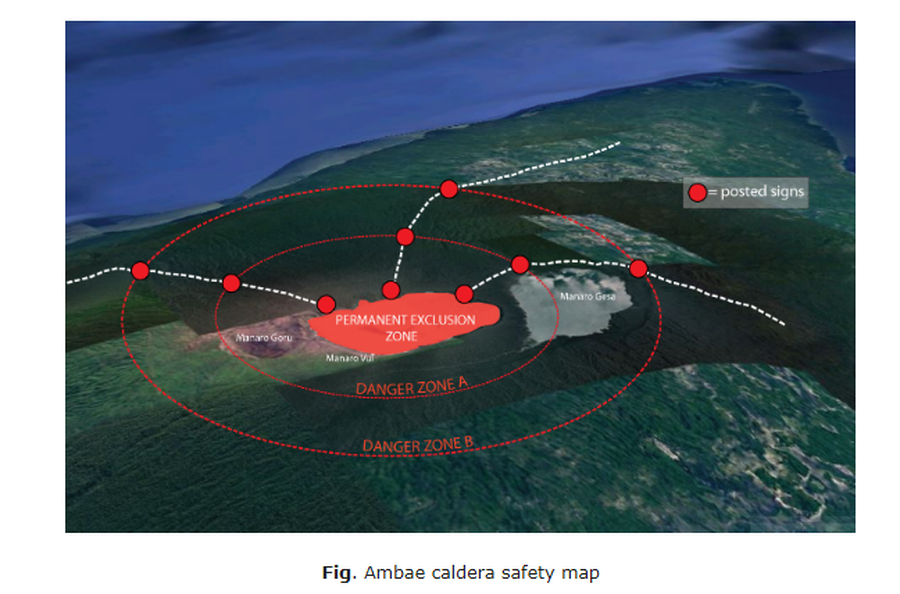
Ambae caldera safety map
Figure 1 in: Vanuatu Meteorology & Geo-Hazards Department. (2020). Vanuatu Volcano Alert Bulletin No. 4 - Ambae Activity, Thursday May 28th 2020.
Official, Figure in hazard assessment
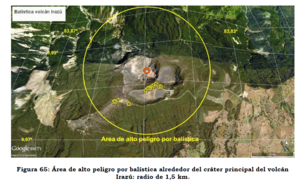
Balística volcán Irazú
(Irazú volcano ballistics)
Figure 65 in: Soto, G.J. & Sjöbohm, L. (2015). Escenarios de amenaza del volcán Irazú (Costa Rica): Una aproximación preliminar. FUNDEVI, Universidad de Costa Rica, Escuela Centroamericana de Geología. 188 p. https://doi.org/10.13140/RG.2.2.22061.54240
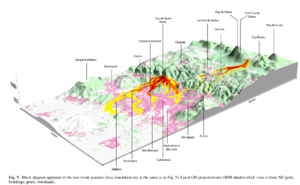
Figure in a journal article
Block diagram appraisal of the two event scenario
Figure 9 in: Latutrie, B., Andredakis, I., De Groeve, T., Harris, A. J. L., Langlois, E., de Vries, B. V. W., Saubin, E., Bilotta, G., Cappello, A., Crisci, G.M., D'ambrosio, D., Del Negro, C., Favalli, M., Fujita, E., Iovine, G., Kelfoun, K., Rongo, R., Spataro, W., Tarquini, S., Coppola, D., Ganci, G., Marchese, F., Pergola, N., & Tramutoli, V. (2016). Testing a geographical information system for damage and evacuation assessment during an effusive volcanic crisis. In: Harris, A.J.L., De Groeve, T., & Carn, S.A. (Eds.) Detecting, Modelling and Responding to Effusive Eruptions. Geological Society, London, Special Publications, 426(1), p. 649-672. https://doi.org/10.1144/SP426.19
Official, Figure in hazard assessment
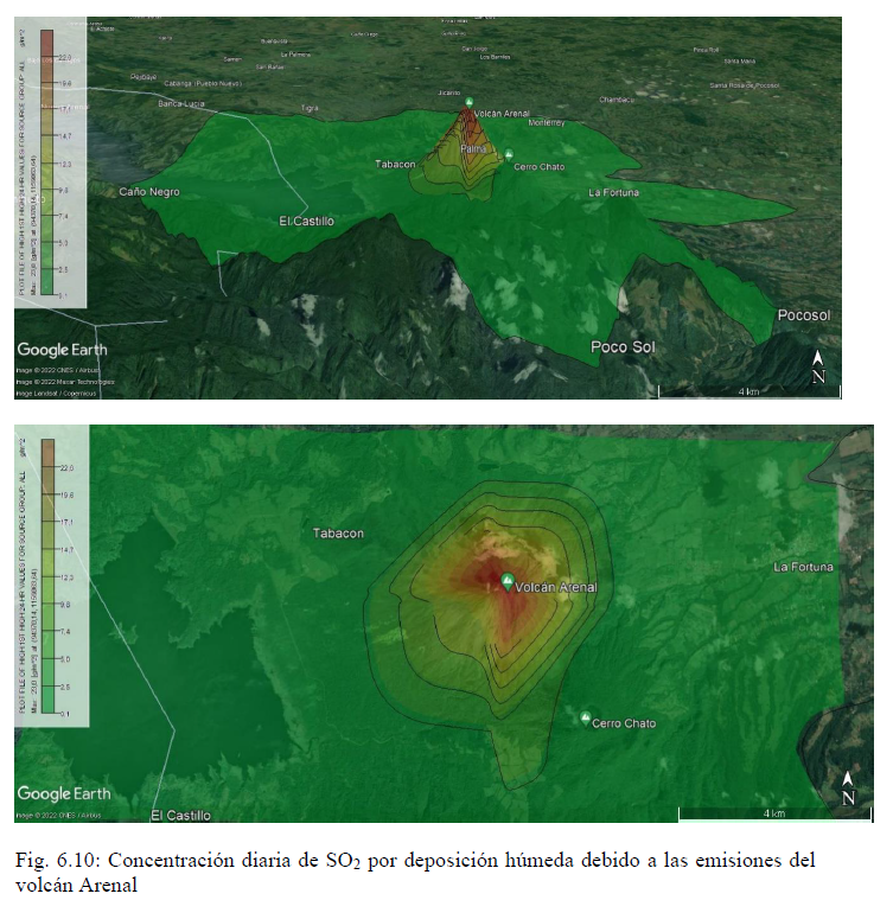
Concentración diaria de SO2 por deposición húmeda debido a las emisiones del volcán Arenal
(Daily SO2 concentration due to wet deposition of emissions from the Arenal volcano)
Figure 6.10 in: Alvarado, G.E., Brenes-André, F., Núñez, D., Borbón, J., Ramírez, M.A., Alpízar, Y., Núñez, S., Sibaja, J.P., Esquivel, L. (2023). Actualización del Análisis del Peligro Volcánico del Arenal, Costa Rica. Instituto Costarricense de Electricidad (ICE). Mayo 2023.
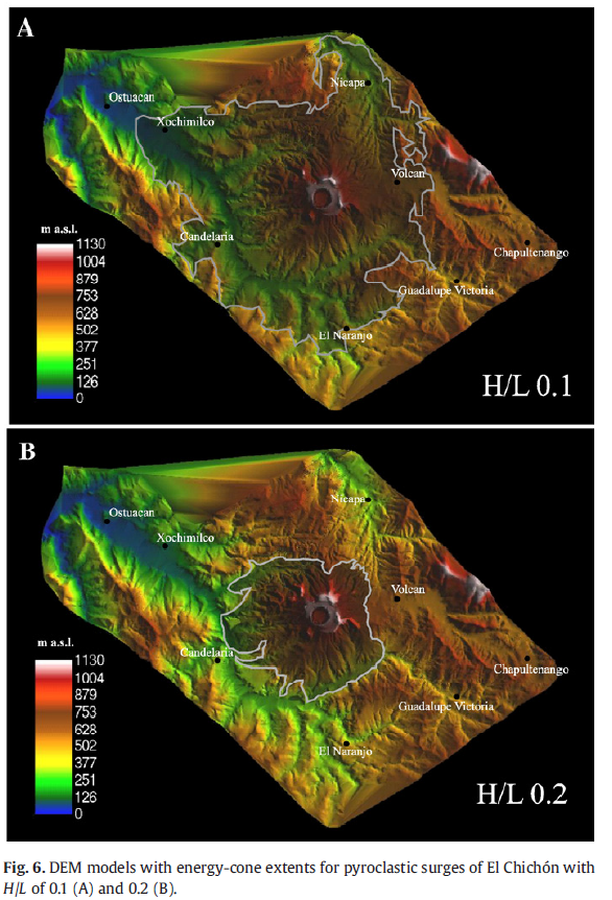
Figure in a journal article
DEM models with energy-cone extents for pyroclastic surges of El Chichón with H/L of 0.1 (A) and 0.2 (B).
Figure 6 in: Macías, J. L., Capra, L., Arce, J. L., Espíndola, J. M., García-Palomo, A., & Sheridan, M. F. (2008). Hazard map of El Chichón volcano, Chiapas, México: Constraints posed by eruptive history and computer simulations. Journal of Volcanology and Geothermal Research, 175(4), 444-458. https://doi.org/10.1016/j.jvolgeores.2008.02.023
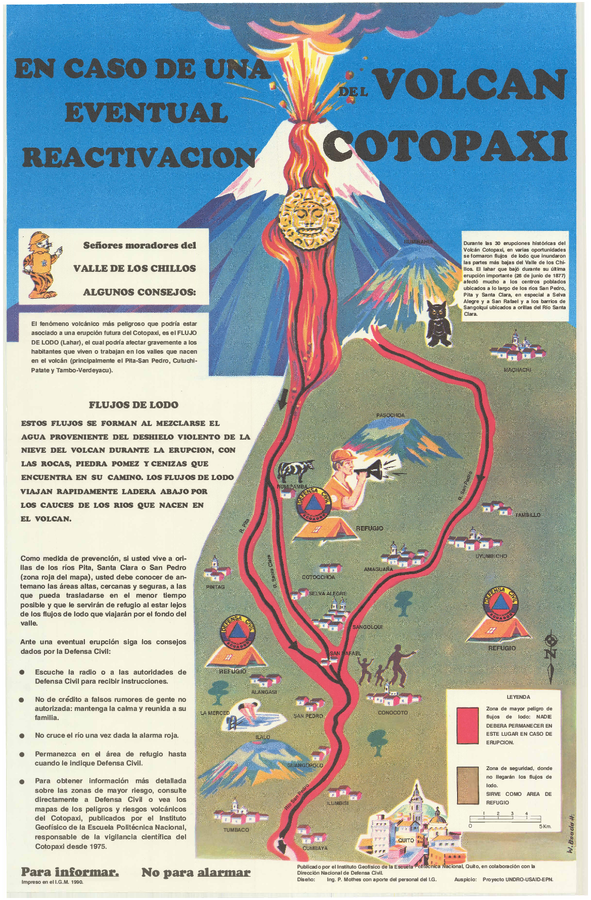
Official, Sign or billboard
En Caso de Una Eventual Reactivacion del Volcan Cotopaxi
(In Case of a Possible Reactivation of the Cotopaxi Volcano)
Mothes, P. (1990). En Caso de Una Eventual Reactivacion del Volcan Cotopaxi. Instituto Geofísico de la Escuela Politecnica Nacional and Dirección Nacional (IG-EPN) de Defensa Civil, Quito.
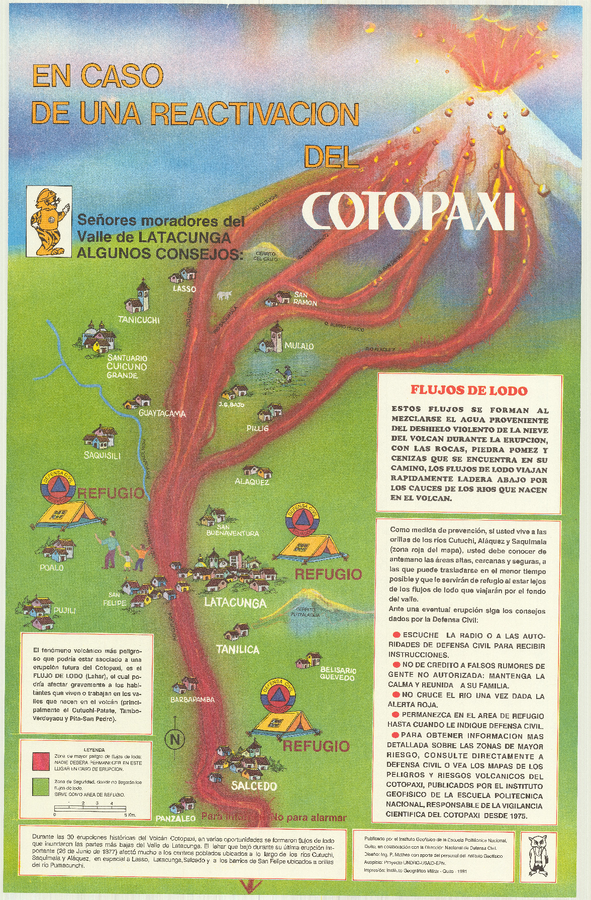
Official, Sign or billboard
En Caso de Una Eventual Reactivacion del Volcan Cotopaxi
(In Case of a Possible Reactivation of the Cotopaxi Volcano)
Mothes, P. (1991). En Caso de Una Eventual Reactivacion del Volcan Cotopaxi. Instituto Geofísico de la Escuela Politecnica Nacional (IG-EPN) and Dirección Nacional de Defensa Civil, Quito.

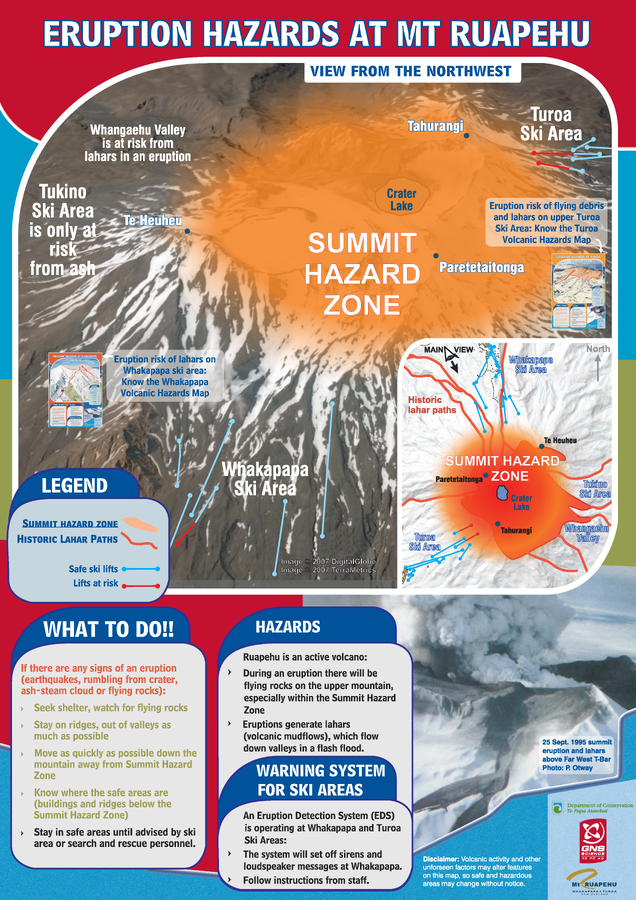
Official, Sign or billboard
Eruption Hazards at Mt. Ruapehu
GNS Science (compiler). (2007). Eruption Hazards at Mt. Ruapehu. 8 October 2007.
Official, Sign or billboard
Eruption Hazards at Mt. Ruapehu
GNS Science (compiler). (2008). Eruption Hazards at Mt. Ruapehu.

Figure in a journal article
Estimated Travel Time of Mudflows at Mount Hood, Oregon
Preppernau, C. A., & Jenny, B. (2016). Estimated travel time of mudflows at Mount Hood, Oregon. Journal of Maps, 12(5), p. 711-715. https://doi.org/10.1080/17445647.2015.1120244