
Advanced Search for Maps
Showing 11-13 of 13
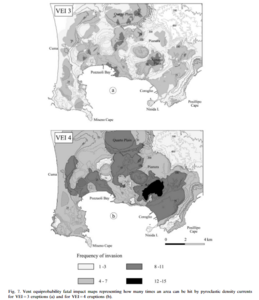
Figure in a journal article
Vent equiprobability fatal impact maps representing how many times an area can be hit by pyroclastic density currents for VEI=3 eruptions and for VEI=4 eruptions
Figure 7 in: Alberico, I., Lirer, L., Petrosino, P., & Scandone, R. (2002). A methodology for the evaluation of long-term volcanic risk from pyroclastic flows in Campi Flegrei (Italy). Journal of Volcanology and Geothermal Research, 116(1-2), p. 63-78. https://doi.org/10.1016/S0377-0273(02)00211-1
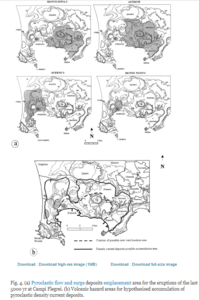
Figure in a journal article
Volcanic hazard areas for hypothesised accumulation of pyroclastic density current deposits
Figure 4 in: Lirer, L., Petrosino, P., & Alberico, I. (2001). Hazard assessment at volcanic fields: the Campi Flegrei case history. Journal of volcanology and geothermal research, 112(1-4), p. 53-73. https://doi.org/10.1016/S0377-0273(01)00234-7
Campi Flegrei, Italy
Figure in a journal article
Volcanic hazard map of the Campi Flegrei caldera
Figure 16 in: Orsi, G., Di Vito, M. A., & Isaia, R. (2004). Volcanic hazard assessment at the restless Campi Flegrei caldera. Bulletin of Volcanology, 66(6), p. 514-530. https://doi.org/10.1007/s00445-003-0336-4
Figure in a journal article
Volcanic hazard map of the Campi Flegrei caldera
Figure 16 in: Orsi, G., Di Vito, M. A., & Isaia, R. (2004). Volcanic hazard assessment at the restless Campi Flegrei caldera. Bulletin of Volcanology, 66(6), p. 514-530. https://doi.org/10.1007/s00445-003-0336-4
Page: 1 2