
Advanced Search for Maps
Showing 21-30 of 36
Official, Map sheet or poster
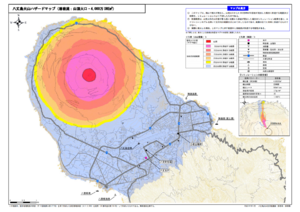
Hachijojima Volcano Hazard Map (Lava flow: Summit crater, 40 million m³ DRE)
Hachijojima Volcano Disaster Prevention Council. (2017). Hachijojima volcano hazard map. Disaster Prevention Division, Bureau of General Affairs, Tokyo Metropolitan Government.
Official, Map sheet or poster
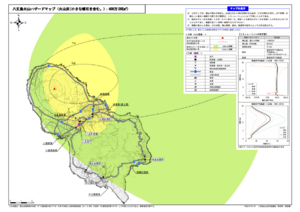
Hachijojima volcano hazard map (volcanic ash including volcanic lapilli: 16 million m³ DRE)
Hachijojima Volcano Disaster Prevention Council. (2017). Hachijojima volcano hazard map. Disaster Prevention Division, Bureau of General Affairs, Tokyo Metropolitan Government.
Official, Map sheet or poster
Hachijojima volcano hazard map (volcanic ash including volcanic lapilli: 4 million m³ DRE)
Hachijojima Volcano Disaster Prevention Council. (2017). Hachijojima volcano hazard map. Disaster Prevention Division, Bureau of General Affairs, Tokyo Metropolitan Government.

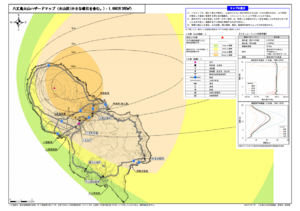
Official, Map sheet or poster
Hachijojima volcano hazard map (volcanic ash including volcanic lapilli: 40 million m³ DRE)
Hachijojima Volcano Disaster Prevention Council. (2017). Hachijojima volcano hazard map. Disaster Prevention Division, Bureau of General Affairs, Tokyo Metropolitan Government.
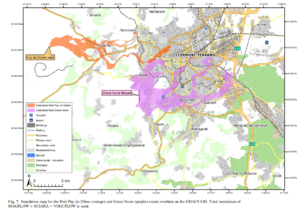
Figure in a journal article
Inundation map for the Petit Puy de Dome (orange) and Grave Noire (purple) events overlain on the GDACS GIS
Figure 7 in: Latutrie, B., Andredakis, I., De Groeve, T., Harris, A. J. L., Langlois, E., de Vries, B. V. W., Saubin, E., Bilotta, G., Cappello, A., Crisci, G.M., D'ambrosio, D., Del Negro, C., Favalli, M., Fujita, E., Iovine, G., Kelfoun, K., Rongo, R., Spataro, W., Tarquini, S., Coppola, D., Ganci, G., Marchese, F., Pergola, N., & Tramutoli, V. (2016). Testing a geographical information system for damage and evacuation assessment during an effusive volcanic crisis. In: Harris, A.J.L., De Groeve, T., & Carn, S.A. (Eds.) Detecting, Modelling and Responding to Effusive Eruptions. Geological Society, London, Special Publications, 426(1), p. 649-672. https://doi.org/10.1144/SP426.19
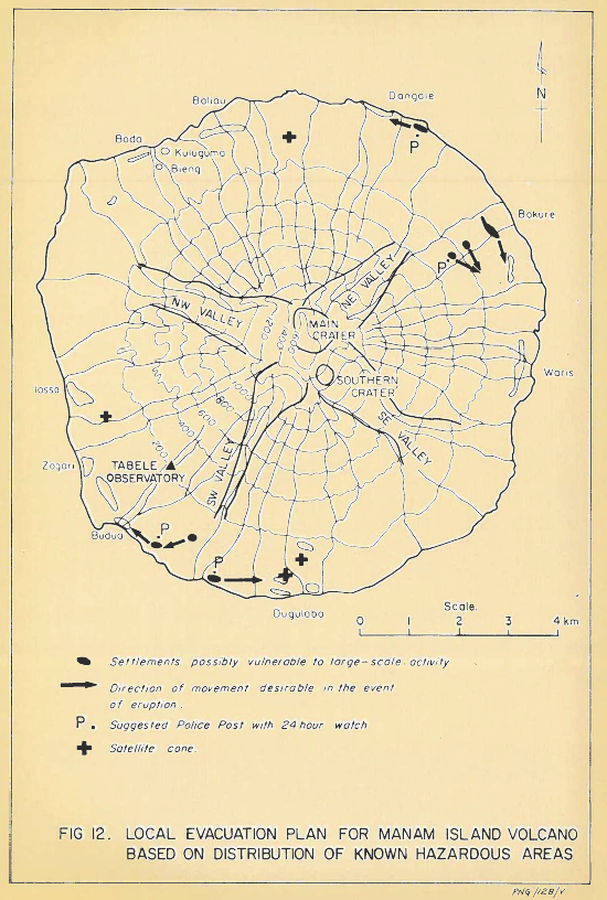
Official, Figure in hazard assessment
Local evacuation plan for Manam Island Volcano based on distribution of known hazardous areas
Figure 12 in: Lowenstein, P.L. (1982). Problems of volcanic hazards in Papua New Guinea. Geological Survey of Papua New Guinea, Report 82/7, 62 p.
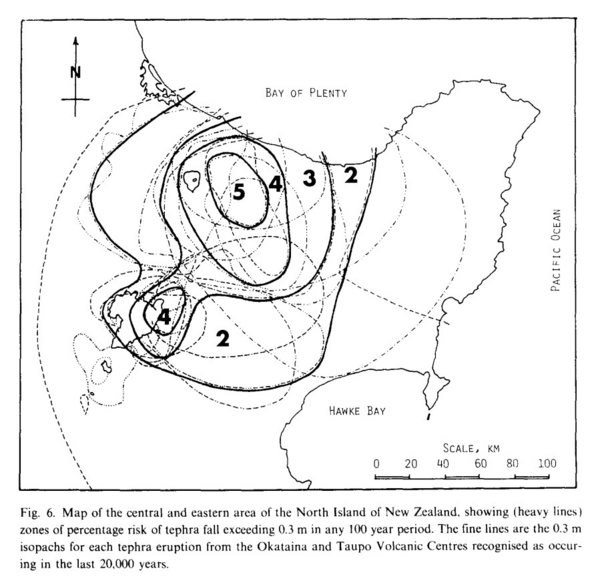
Figure in a journal article
Map of the central and eastern area of the North Island of New Zealand, showing (heavy lines) zones of percentage risk of tephra fall exceeding 0.3 m in any 100 year period
Figure 6 in: Dibble, R.R., Nairn, I.A., & Neall, V.E. (1985). Volcanic hazards of North Island, New Zealand--Overview. Journal of Geodynamics, 3, p. 369-396. https://doi.org/10.1016/0264-3707(85)90043-2
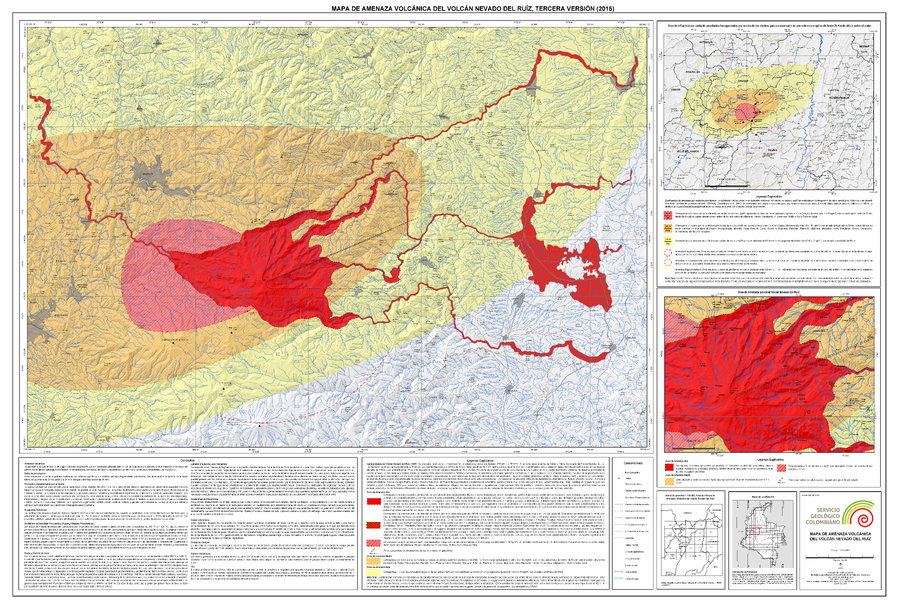
Official, Map sheet or poster
Mapa de Amenaza Volcánica del Volcán Nevado del Ruiz, Tercera Versión (2015)
(Volcanic Hazard Map of Nevado del Ruiz Volcano, Third Version (2015))
Servicio Geológico Colombiano (SGC). (2015). Mapa de Amenaza Volcánica del Volcán Nevado del Ruiz, Tercera Version. mapa escala 1:120,000. Bogota.
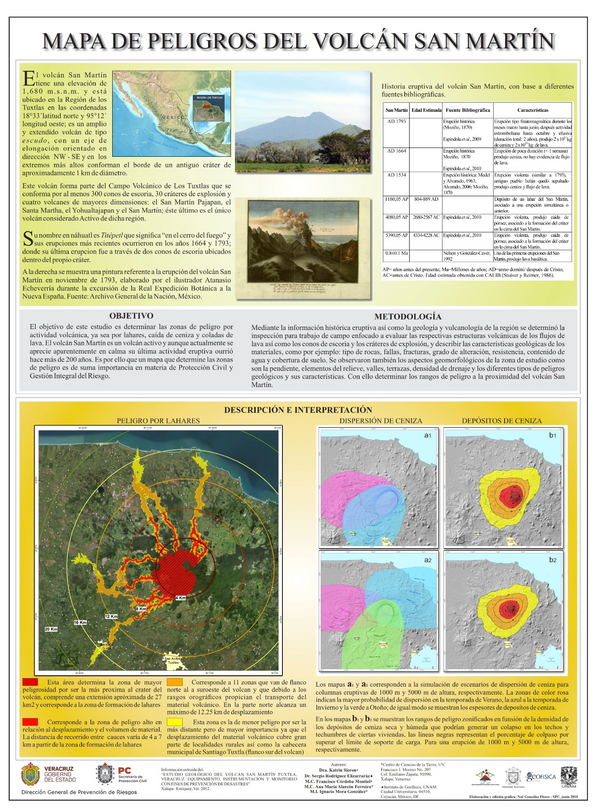
Official, Map sheet or poster
Mapa de Peligros del Volcán San Martín
(San Martín Volcano Hazard Map)
Sieron, K., Rodríguez Elizarraráz, S., Córdoba Montiel, F., Alarcón Ferreira, A.M., & Mora González, I. (2018). Mapa de Peligros del Volcán San Martín. Centro de Ciencias de la Tierra, UV & Instituto de Geofísica, UNAM
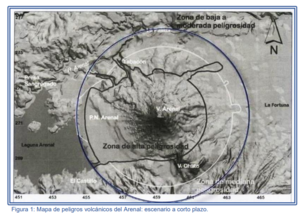
Figure in a journal article
Mapa de peligros volcánicos del Arenal: escenario a corto plazo
(Arenal volcanic hazard map: short-term scenario)
Figure 1 in: Soto, G.J. & Sjöbohm, L. (2007). Los Peligros volcánicos del Arenal. En torno a la Prevencion. Revista No. 4, Junio 2007. Comisión Nacional de Prevención de Riesgos y Atención de Emergencias (CNE).