
Advanced Search for Maps
Showing 31-40 of 385
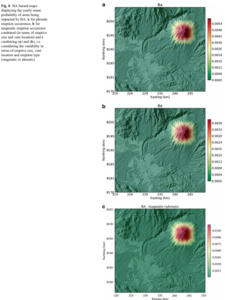
Figure in a journal article
BA hazard maps displaying the yearly mean probability of areas being impacted by BA
Figure 8 in: Sandri, L., Thouret, J. C., Constantinescu, R., Biass, S., & Tonini, R. (2014). Long-term multi-hazard assessment for El Misti volcano (Peru). Bulletin of volcanology, 76(2), 771. https://doi.org/10.1007/s00445-013-0771-9
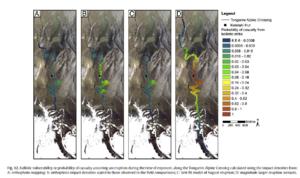
Figure in a journal article
Ballistic vulnerability or probability of casualty assuming an eruption during the time of exposure, along the Tongariro Alpine Crossing
Figure 12 in: Fitzgerald, R. H., Tsunematsu, K., Kennedy, B. M., Breard, E. C. P., Lube, G., Wilson, T. M., Jolly, A.D., Pawson, J., Rosenburg, M.D., & Cronin, S. J. (2014). The application of a calibrated 3D ballistic trajectory model to ballistic hazard assessments at Upper Te Maari, Tongariro. Journal of volcanology and geothermal research, 286, p. 248-262. https://doi.org/10.1016/j.jvolgeores.2014.04.006
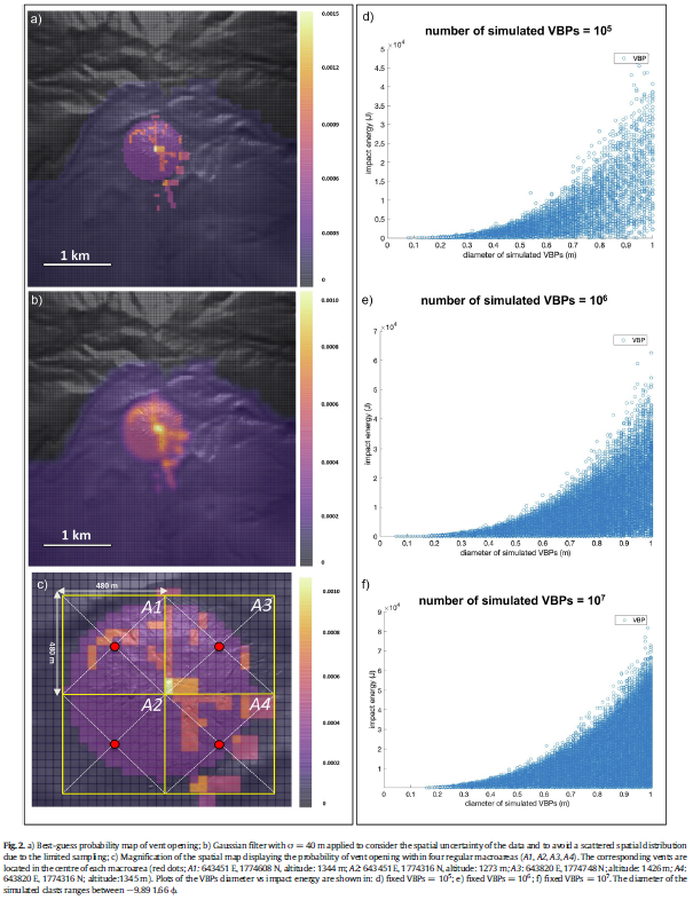
Figure in a journal article
Best-guess probability map of vent opening
Figure 2 in: Massaro, S., Rossi, E., Sandri, L., Bonadonna, C., Selva, J., Moretti, R., & Komorowski, J. C. (2022). Assessing hazard and potential impact associated with volcanic ballistic projectiles: The example of La Soufrière de Guadeloupe volcano (Lesser Antilles). Journal of volcanology and geothermal research, 423, 107453. https://doi.org/10.1016/j.jvolgeores.2021.107453
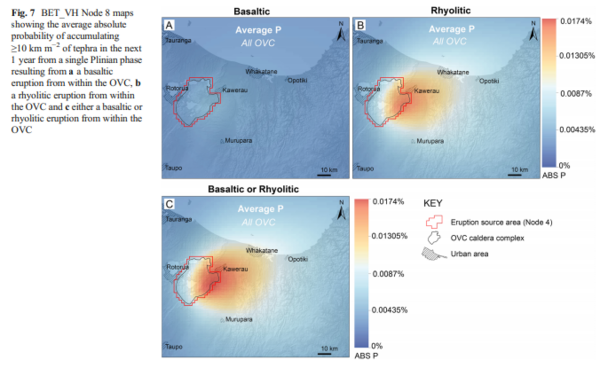
Figure in a journal article
BET_VH Node 8 maps showing the average absolute probability of accumulating ≥10 km m−2 of tephra in the next 1 year from a single Plinian phase resulting from a a basaltic eruption from within the OVC, b a rhyolitic eruption from within the OVC and c either a basaltic or rhyolitic eruption from within the OVC
Figure 7 in: Thompson, M. A., Lindsay, J. M., Sandri, L., Biass, S., Bonadonna, C., Jolly, G., & Marzocchi, W. (2015). Exploring the influence of vent location and eruption style on tephra fall hazard from the Okataina Volcanic Centre, New Zealand. Bulletin of volcanology, 77(5), 38. https://doi.org/10.1007/s00445-015-0926-y
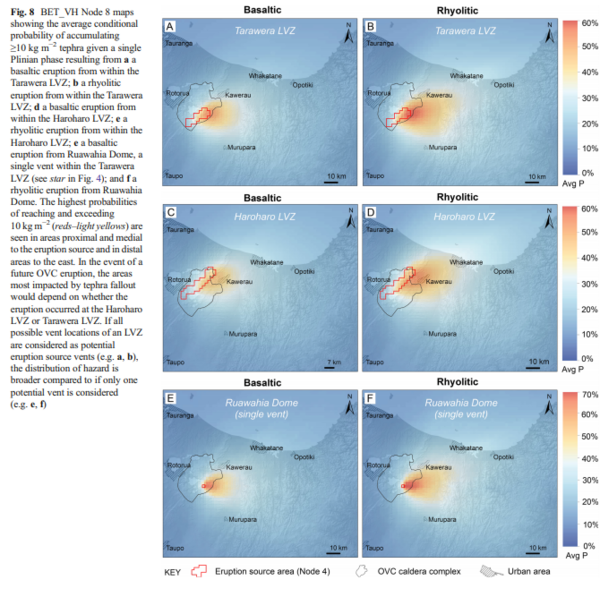
Figure in a journal article
BET_VH Node 8 maps showing the average conditional probability of accumulating ≥10 kg m−2 tephra given a single Plinian phase resulting from a a basaltic eruption from within the Tarawera LVZ; b a rhyolitic eruption from within the Tarawera LVZ; d a basaltic eruption from within the Haroharo LVZ; e a rhyolitic eruption from within the Haroharo LVZ; e a basaltic eruption from Ruawahia Dome, a single vent within the Tarawera LVZ (see star in Fig. 4); and f a rhyolitic eruption from Ruawahia Dome
Figure 8 in: Thompson, M. A., Lindsay, J. M., Sandri, L., Biass, S., Bonadonna, C., Jolly, G., & Marzocchi, W. (2015). Exploring the influence of vent location and eruption style on tephra fall hazard from the Okataina Volcanic Centre, New Zealand. Bulletin of volcanology, 77(5), 38. https://doi.org/10.1007/s00445-015-0926-y
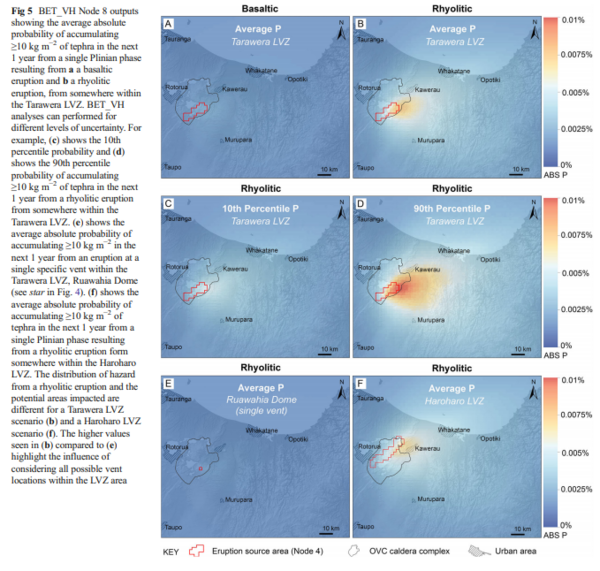
Figure in a journal article
BET_VH Node 8 outputs showing the average absolute probability of accumulating ≥10 kg m−2 of tephra in the next 1 year from a single Plinian phase resulting from a a basaltic eruption and b a rhyolitic eruption, from somewhere within the Tarawera LVZ
Figure 5 in: Thompson, M. A., Lindsay, J. M., Sandri, L., Biass, S., Bonadonna, C., Jolly, G., & Marzocchi, W. (2015). Exploring the influence of vent location and eruption style on tephra fall hazard from the Okataina Volcanic Centre, New Zealand. Bulletin of volcanology, 77(5), 38. https://doi.org/10.1007/s00445-015-0926-y

Figure in a journal article
Carte de Risque Volcanique
(Volcanic Hazard Map)
Figure 1 in: Tedesco, D. (2003). 1995 Nyiragongo and Nyamulagira activity in the Virunga National Park: A volcanic crisis. Acta vulcanologica, 14(1-2), 149-155.
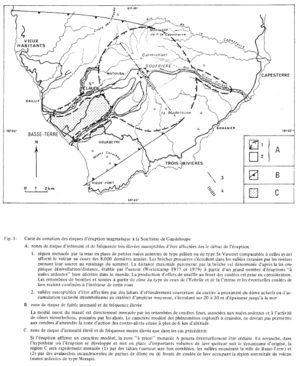
Figure in a journal article
Carte de zonation des risques d'éruption magmatique à la Soufrière de Guadeloupe
(Zonation map of magmatic eruption risks at Soufrière in Guadeloupe)
Figure 5 in: Westercamp, D. (1981). Cartographie du risque volcanique a la soufriere de guadeloupe: Retrospective et tendance actuelle. Bulletin of the International Association of Engineering Geology-Bulletin de l'Association Internationale de Géologie de l'Ingénieur, 23(1), p. 25-32. https://doi.org/10.1007/BF02594723
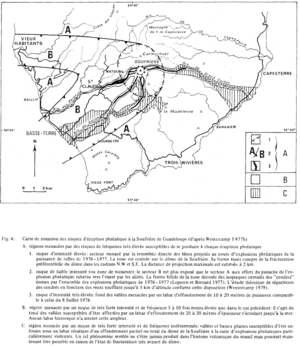
Figure in a journal article
Carte de zonation des risques d'éruption phréatique à la Soufrière de Guadeloupe (d'après Westercamp 1977b)
(Zonation map of phreatic eruption risks at Soufrière in Guadeloupe (from Westercamp 1977b))
Figure 4 in: Westercamp, D. (1981). Cartographie du risque volcanique a la soufriere de guadeloupe: Retrospective et tendance actuelle. Bulletin of the International Association of Engineering Geology-Bulletin de l'Association Internationale de Géologie de l'Ingénieur, 23(1), p. 25-32. https://doi.org/10.1007/BF02594723
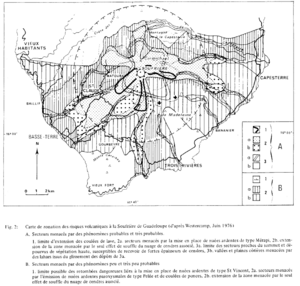
Figure in a journal article
Carte de zonation des risques volcaniques á la Soufrière de Guadeloupe (d'ápres Westercamp, Juin 1976)
(Zonation map of volcanic risks at Soufrière in Guadeloupe (after Westercamp, June 1976))
Figure 2 in: Westercamp, D. (1981). Cartographie du risque volcanique a la soufriere de guadeloupe: Retrospective et tendance actuelle. Bulletin of the International Association of Engineering Geology-Bulletin de l'Association Internationale de Géologie de l'Ingénieur, 23(1), p. 25-32. https://doi.org/10.1007/BF02594723