
Advanced Search for Maps
Showing 51-60 of 385
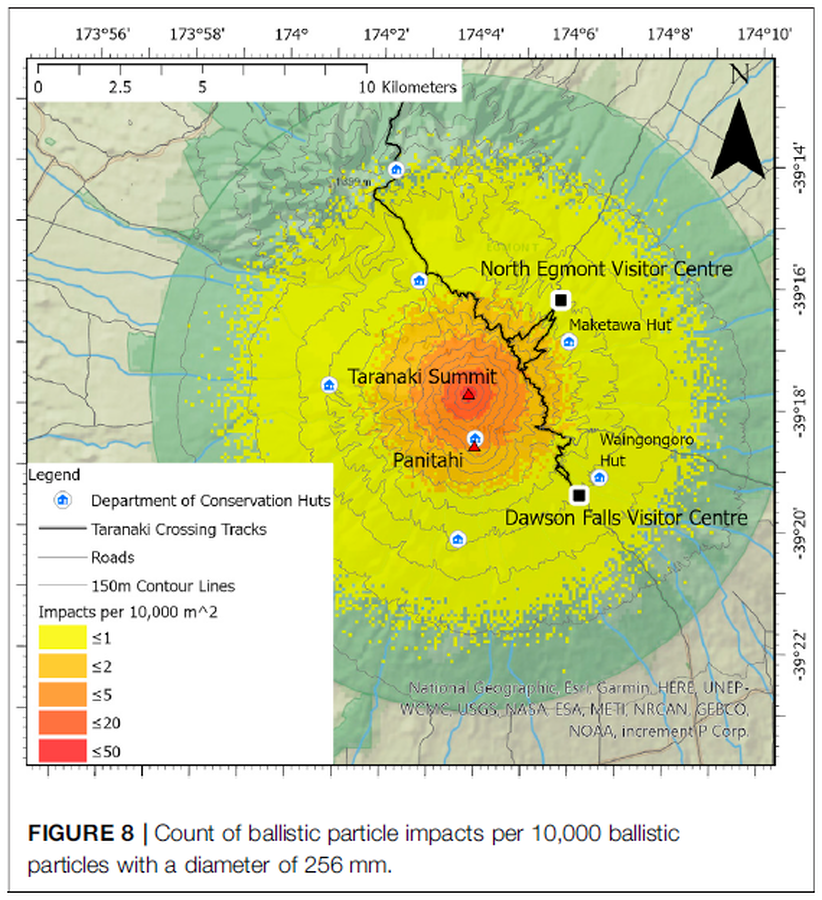
Figure in a journal article
Count of ballistic particle impacts per 10,000 ballistic particles with a diameter of 256 mm
Figure 8 in: Mead, S., Procter, J., Bebbington, M., & Rodriguez-Gomez, C. (2022). Probabilistic Volcanic Hazard Assessment for National Park Infrastructure Proximal to Taranaki Volcano (New Zealand). Frontiers in Earth Science, 435. https://doi.org/10.3389/feart.2022.832531
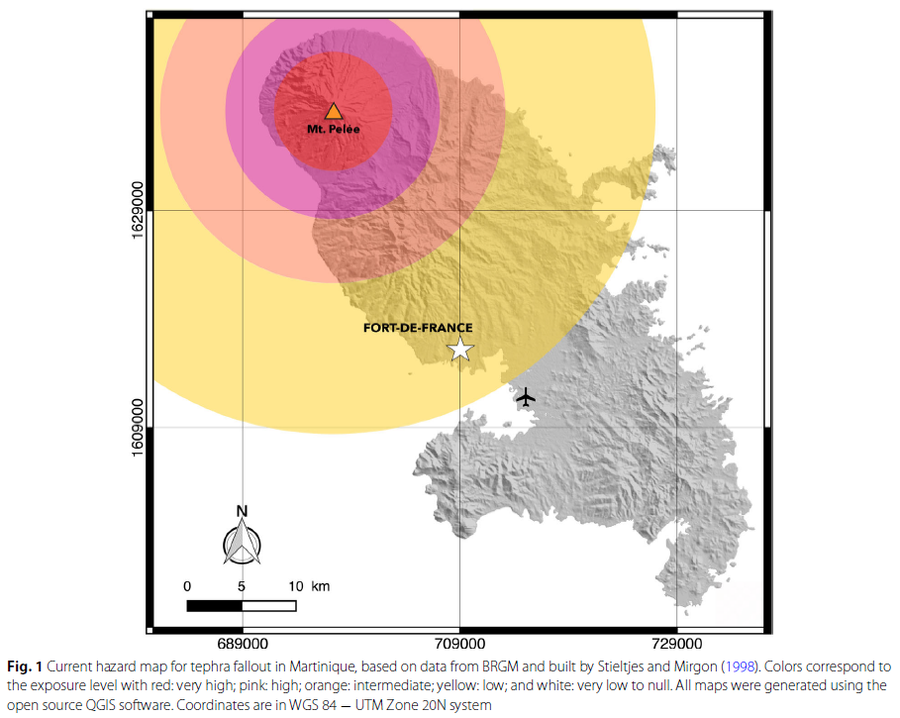
Figure in a journal article
Current hazard map for tephra fallout in Martinique
Figure 1 in: Michaud-Dubuy, A., Carazzo, G., & Kaminski, E. (2021). Volcanic hazard assessment for tephra fallout in Martinique. Journal of Applied Volcanology, 10(1), 1-20. https://doi.org/10.1186/s13617-021-00106-7. (Modified from: Stieltjes & Mirgon 1998)
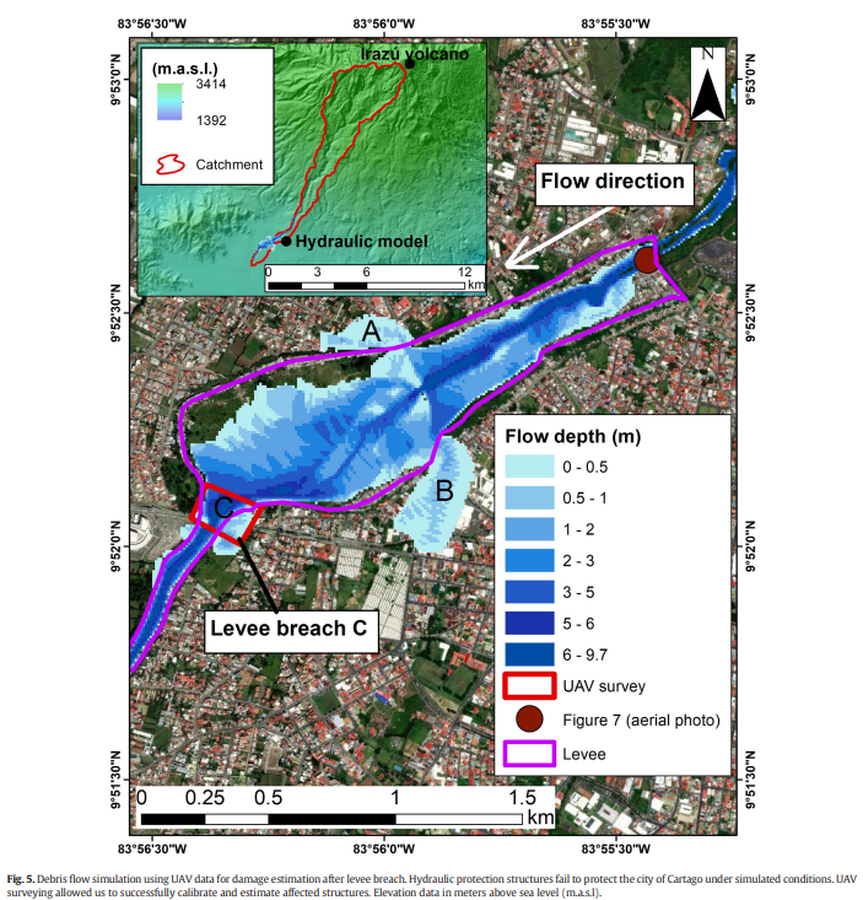
Figure in a journal article
Debris flow simulation using UAV data for damage estimation after levee breach
Figure 5 in: Granados-Bolaños, S., Quesada-Román, A., & Alvarado, G. E. (2021). Low-cost UAV applications in dynamic tropical volcanic landforms. Journal of Volcanology and Geothermal Research, 410, 107143.

Figure in a journal article
Delineation of impact areas for three VBP diameters ejected during the scenario of a hydrothermal eruption at the Hsiaoyiokeng fumarole
Figure 6 in: Nurmawati, A., & Konstantinou, K. I. (2018). Hazard assessment of volcanic ballistic impacts at Mt Chihshin, Tatun Volcano Group, northern Taiwan. Natural hazards, 92(1), p. 77-92. https://doi.org/10.1007/s11069-018-3192-4
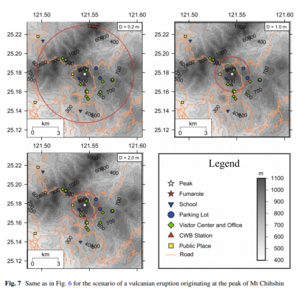
Figure in a journal article
Delineation of impact areas for three VBP diameters ejected during the scenario of a vulcanian eruption originating at the peak of Mt Chihshin
Figure 7 in: Nurmawati, A., & Konstantinou, K. I. (2018). Hazard assessment of volcanic ballistic impacts at Mt Chihshin, Tatun Volcano Group, northern Taiwan. Natural hazards, 92(1), p. 77-92. https://doi.org/10.1007/s11069-018-3192-4
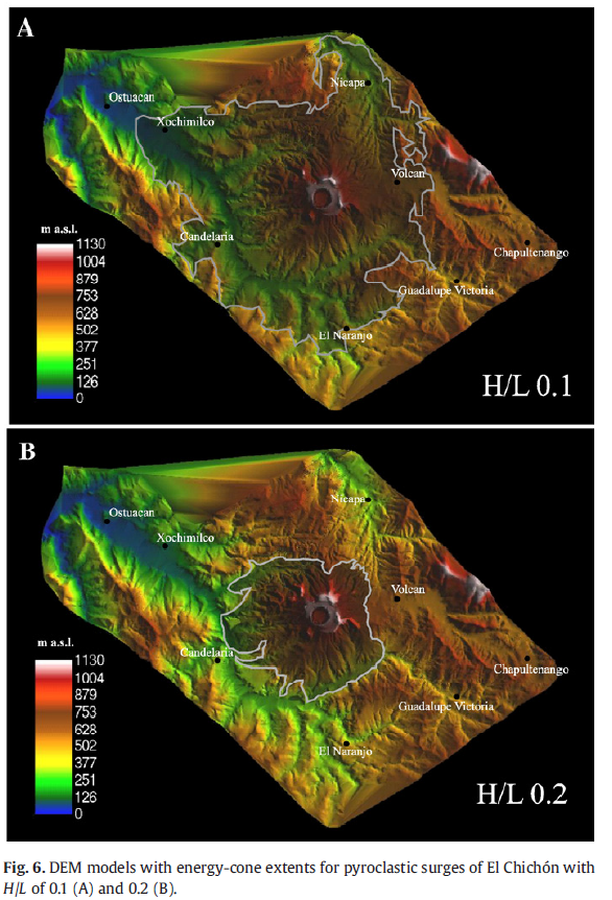
Figure in a journal article
DEM models with energy-cone extents for pyroclastic surges of El Chichón with H/L of 0.1 (A) and 0.2 (B).
Figure 6 in: Macías, J. L., Capra, L., Arce, J. L., Espíndola, J. M., García-Palomo, A., & Sheridan, M. F. (2008). Hazard map of El Chichón volcano, Chiapas, México: Constraints posed by eruptive history and computer simulations. Journal of Volcanology and Geothermal Research, 175(4), 444-458. https://doi.org/10.1016/j.jvolgeores.2008.02.023
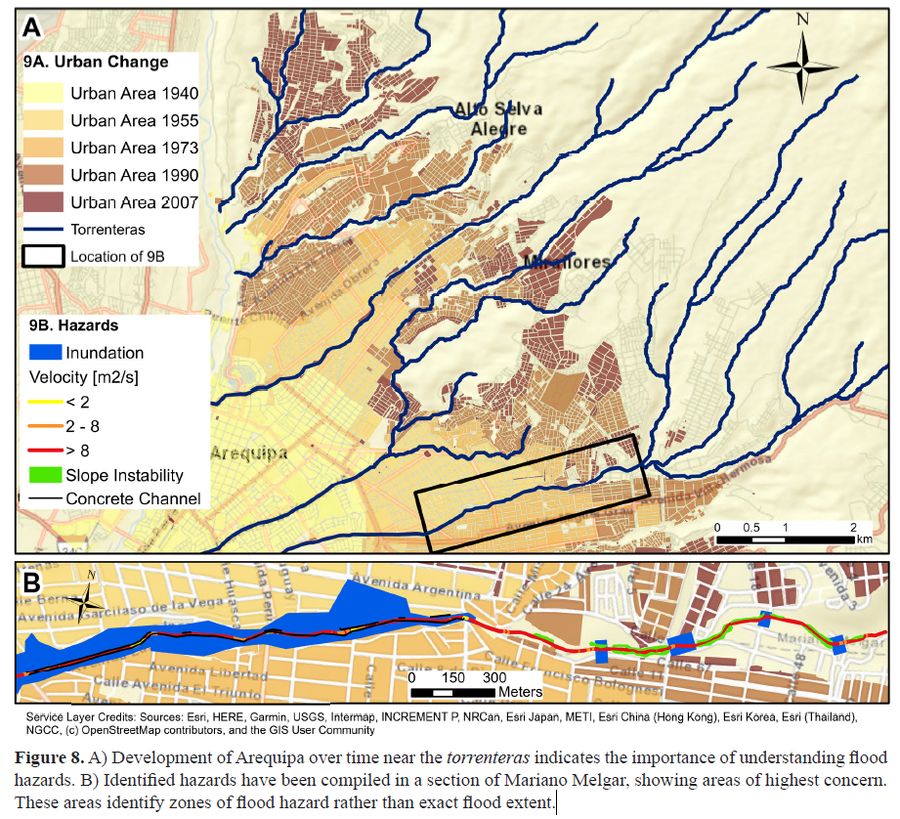
Figure in a journal article
Development of Arequipa over time near the torrenteras indicates the importance of understanding flood hazards
Figure 8 in: Mazer, K. E., Tomasek, A. A., Daneshvar, F., Bowling, L. C., Frankenberger, J. R., McMillan, S. K., Novoa, H.M., & Zeballos‐Velarde, C. (2021). Integrated hydrologic and hydraulic analysis of torrential flood hazard in Arequipa, Peru. Journal of Contemporary Water Research & Education, 171(1), 93-110. https://doi.org/10.1111/j.1936-704X.2020.3347.x
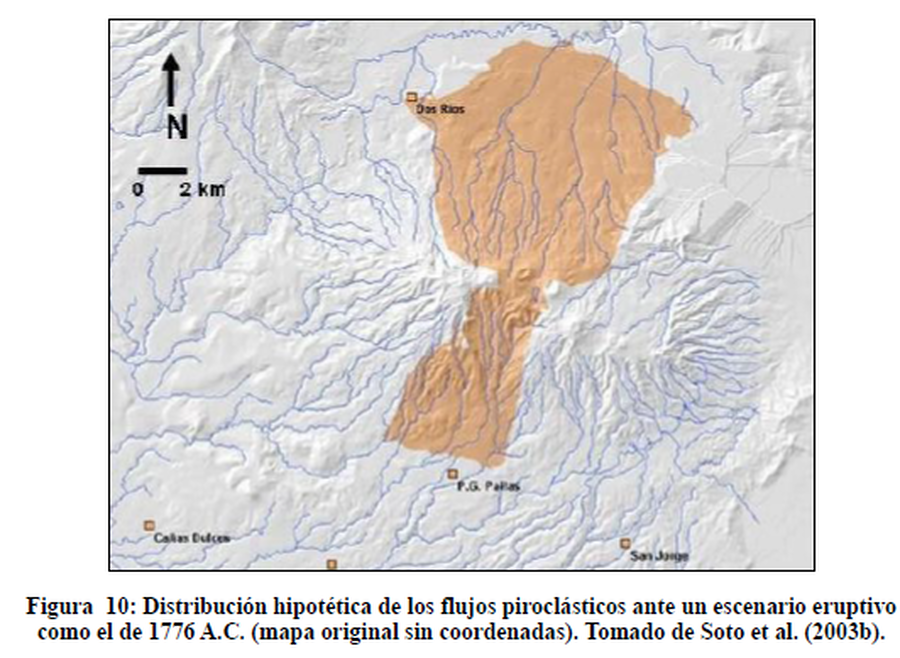
Figure in a thesis or dissertation
Distribución hipotética de los flujos piroclásticos ante un escenario eruptivo como el de 1776 A.C.
(Hypothetical distribution of pyroclastic flows in a eruptive scenario like that of 1776 B.C.)
Figure 10 in: Alpízar, Y. (2018). Mapa Preliminar de Peligros Volcánicos para el Volcán Rincón de la Vieja (Costa Rica): Descripción de un Escenario de Afectación por Lahares. Ciudad Universitaria Rodrigo Facio, Costa Rica. 160 p. (Modified from: Soto et al. 2003)

Figure in a journal article
Early simulations carried out before the onset of the effusive eruption
Figure 4 in: Tarquini, S., de'Michieli Vitturi, M., Jensen, E. H., Pedersen, G. B., Barsotti, S., Coppola, D., & Pfeffer, M. A. (2018). Modeling lava flow propagation over a flat landscape by using MrLavaLoba: the case of the 2014–2015 eruption at Holuhraun, Iceland. Annals of Geophysics. https://doi.org/10.4401/ag-7812
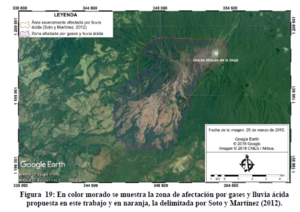
Figure in a thesis or dissertation
En color morado se muestra la zona de afectación por gases y lluvia ácida propuesta en este trabajo y en naranja, la delimitada por Soto y Martínez (2012)
(The zone of affectation by gases and acid rain proposed in this work is shown in purple, and the one delimited by Soto and Martínez (2012) in orange.)
Figure 19 in: Alpízar, Y. (2018). Mapa Preliminar de Peligros Volcánicos para el Volcán Rincón de la Vieja (Costa Rica): Descripción de un Escenario de Afectación por Lahares. Ciudad Universitaria Rodrigo Facio, Costa Rica. 160 p.