
Advanced Search for Maps
Showing 11-20 of 70
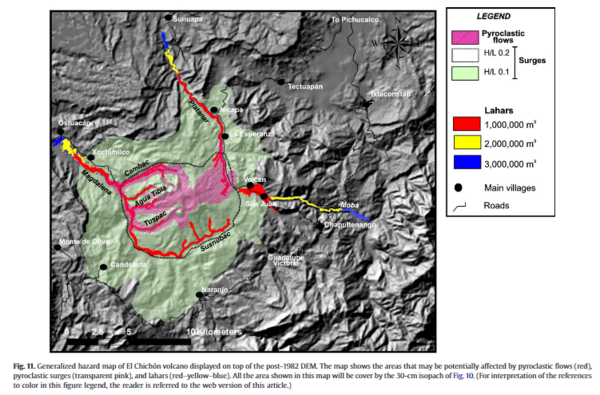
Figure in a journal article
Generalized hazard map of El Chichón volcano displayed on top of the post-1982 DEM
Figure 11 in: Macías, J. L., Capra, L., Arce, J. L., Espíndola, J. M., García-Palomo, A., & Sheridan, M. F. (2008). Hazard map of El Chichón volcano, Chiapas, México: Constraints posed by eruptive history and computer simulations. Journal of Volcanology and Geothermal Research, 175(4), 444-458. https://doi.org/10.1016/j.jvolgeores.2008.02.023
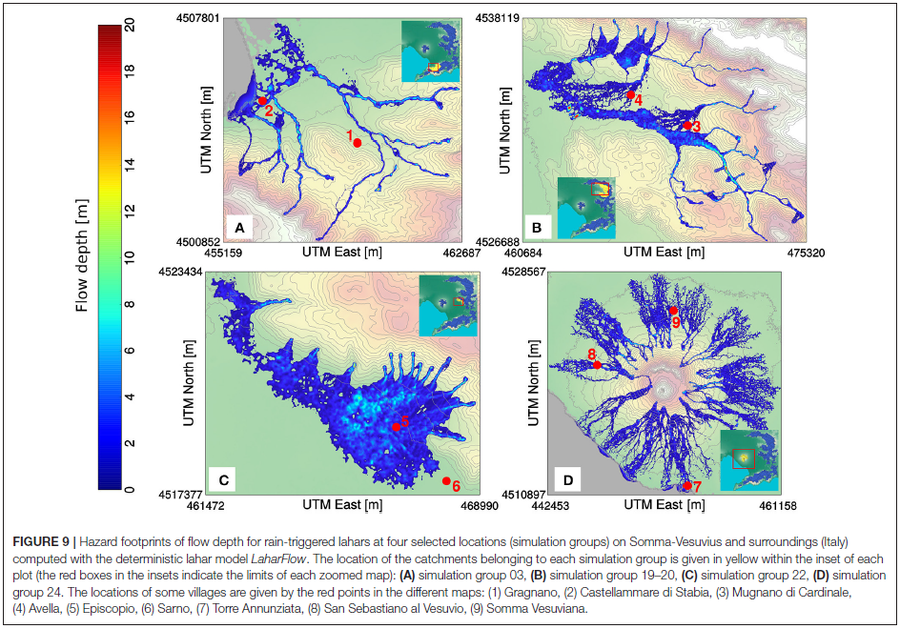
Figure in a journal article
Hazard footprints of flow depth for rain-triggered lahars at four selected locations (simulation groups) on Somma-Vesuvius and surroundings (Italy) computed with the deterministic lahar model LaharFlow
Figure 9 in: Tierz, P., Woodhouse, M.J., Phillips, J.C., Sandri, L., Selva, J., Marzocchi, W., & Odbert, H.M. (2017). A framework for probabilistic multi-hazard assessment of rain-triggered lahars using Bayesian belief networks. Frontiers in Earth Science, 5 (73). https://doi.org/10.3389/feart.2017.00073
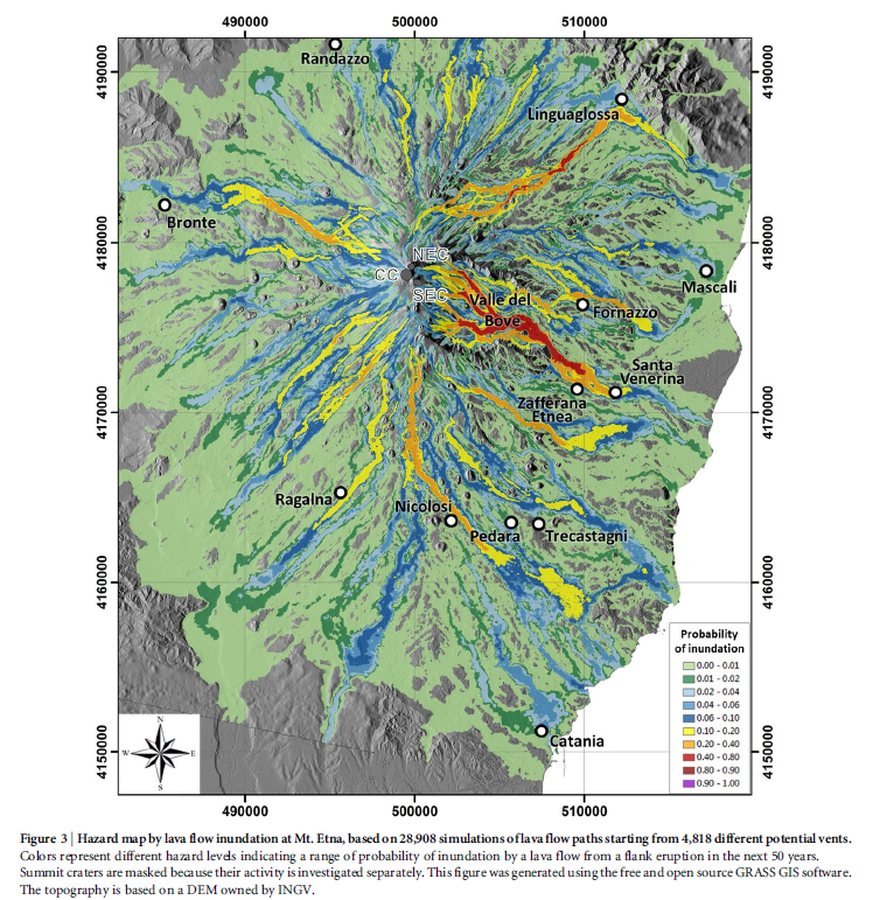
Figure in a journal article
Hazard map by lava flow inundation at Mt. Etna, based on 28,908 simulations of lava flow paths starting from 4,818 different potential vents.
Figure 3 in: Del Negro, C., Cappello, A., Neri, M., Bilotta, G., Hérault, A., & Ganci, G. (2013). Lava flow hazards at Mount Etna: constraints imposed by eruptive history and numerical simulations. Scientific Reports, 3(1). https://doi.org/10.1038/srep03493
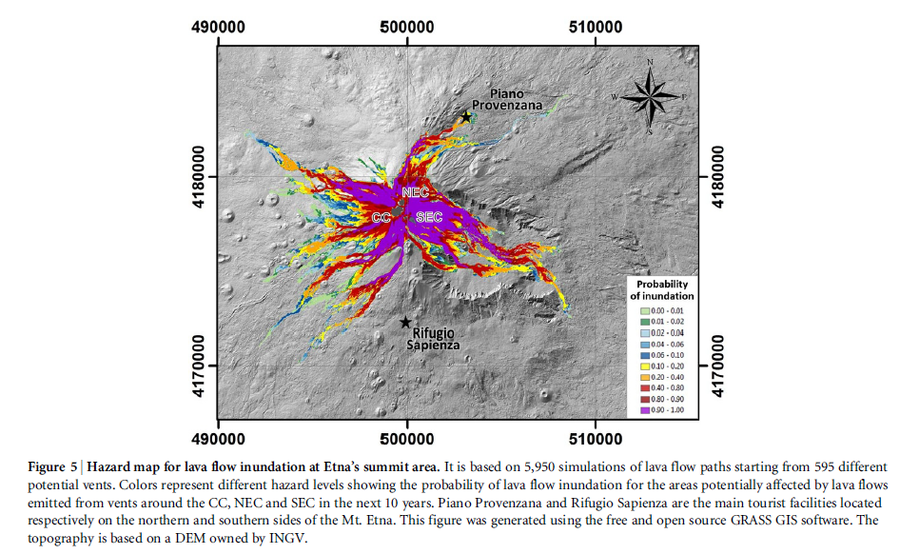
Figure in a journal article
Hazard map for lava flow inundation at Etna’s summit area.
Figure 5 in: Del Negro, C., Cappello, A., Neri, M., Bilotta, G., Hérault, A., & Ganci, G. (2013). Lava flow hazards at Mount Etna: constraints imposed by eruptive history and numerical simulations. Scientific Reports, 3(1). https://doi.org/10.1038/srep03493
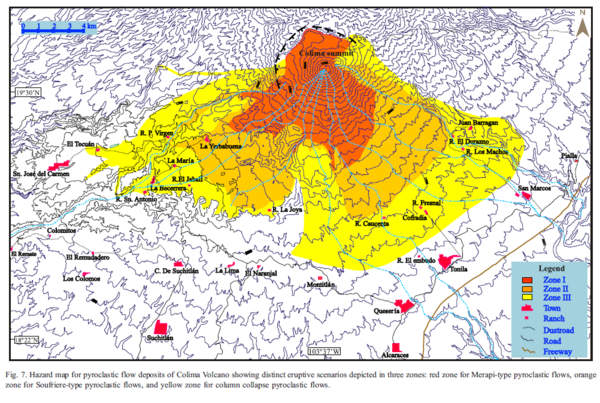
Figure in a journal article
Hazard map for pyroclastic flow deposits of Colima Volcano showing distinct eruptive scenarios depicted in three zones.
Figure 7 in: Saucedo, R., Macías, J.L., Sheridan, M.F., Bursik, M.I., & Komorowski, J.-C. (2005). Modeling of pyroclastic flows of Colima Volcano, Mexico: implications for hazard assessment. Journal of Volcanology and Geothermal Research, 139(1-2), p. 103-115. https://doi.org/10.1016/j.jvolgeores.2004.06.019
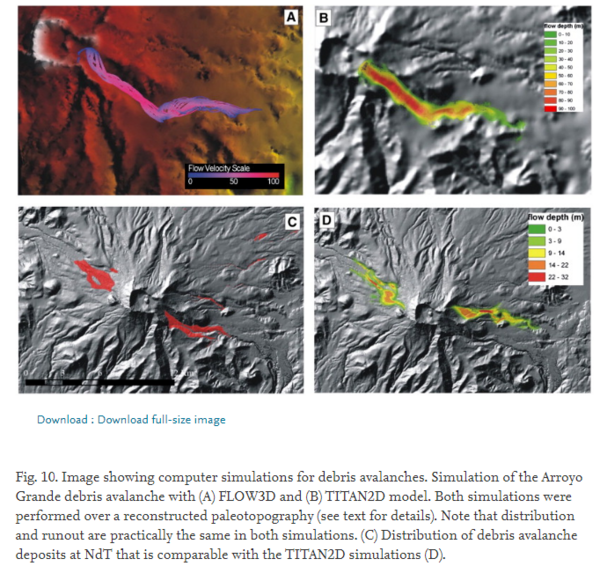
Figure in a journal article
Image showing computer simulations for debris avalanches
Figure 10 in: Capra, L., Norini, G., Groppelli, G., Macías, J.L., & Arce, J.L. (2008). Volcanic hazard zonation of the Nevado de Toluca volcano, México. Journal of Volcanology and Geothermal Research, 176(4), p. 469-484. https://doi.org/10.1016/j.jvolgeores.2008.04.016
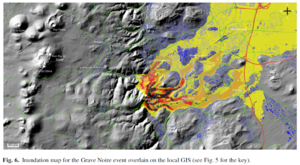
Figure in a journal article
Inundation map for the Grave Noire event overlain on the local GIS
Figure 6 in: Latutrie, B., Andredakis, I., De Groeve, T., Harris, A. J. L., Langlois, E., de Vries, B. V. W., Saubin, E., Bilotta, G., Cappello, A., Crisci, G.M., D'ambrosio, D., Del Negro, C., Favalli, M., Fujita, E., Iovine, G., Kelfoun, K., Rongo, R., Spataro, W., Tarquini, S., Coppola, D., Ganci, G., Marchese, F., Pergola, N., & Tramutoli, V. (2016). Testing a geographical information system for damage and evacuation assessment during an effusive volcanic crisis. In: Harris, A.J.L., De Groeve, T., & Carn, S.A. (Eds.) Detecting, Modelling and Responding to Effusive Eruptions. Geological Society, London, Special Publications, 426(1), p. 649-672. https://doi.org/10.1144/SP426.19
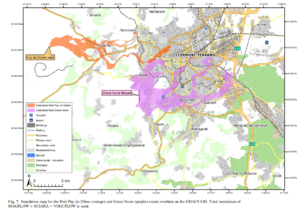
Figure in a journal article
Inundation map for the Petit Puy de Dome (orange) and Grave Noire (purple) events overlain on the GDACS GIS
Figure 7 in: Latutrie, B., Andredakis, I., De Groeve, T., Harris, A. J. L., Langlois, E., de Vries, B. V. W., Saubin, E., Bilotta, G., Cappello, A., Crisci, G.M., D'ambrosio, D., Del Negro, C., Favalli, M., Fujita, E., Iovine, G., Kelfoun, K., Rongo, R., Spataro, W., Tarquini, S., Coppola, D., Ganci, G., Marchese, F., Pergola, N., & Tramutoli, V. (2016). Testing a geographical information system for damage and evacuation assessment during an effusive volcanic crisis. In: Harris, A.J.L., De Groeve, T., & Carn, S.A. (Eds.) Detecting, Modelling and Responding to Effusive Eruptions. Geological Society, London, Special Publications, 426(1), p. 649-672. https://doi.org/10.1144/SP426.19
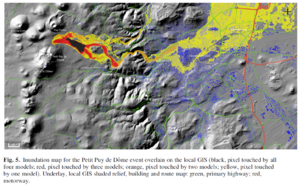
Figure in a journal article
Inundation map for the Petit Puy de Dome event overlain on the local GIS
Figure 5 in: Latutrie, B., Andredakis, I., De Groeve, T., Harris, A. J. L., Langlois, E., de Vries, B. V. W., Saubin, E., Bilotta, G., Cappello, A., Crisci, G.M., D'ambrosio, D., Del Negro, C., Favalli, M., Fujita, E., Iovine, G., Kelfoun, K., Rongo, R., Spataro, W., Tarquini, S., Coppola, D., Ganci, G., Marchese, F., Pergola, N., & Tramutoli, V. (2016). Testing a geographical information system for damage and evacuation assessment during an effusive volcanic crisis. In: Harris, A.J.L., De Groeve, T., & Carn, S.A. (Eds.) Detecting, Modelling and Responding to Effusive Eruptions. Geological Society, London, Special Publications, 426(1), p. 649-672. https://doi.org/10.1144/SP426.19
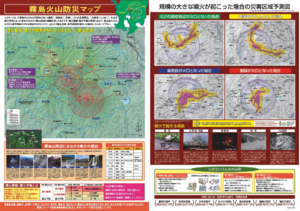
Official, Map sheet or poster
Kirishima Volcano Disaster Prevention Map
Kan-Kirishima Conference. (2009). Kirishima Volcano Disaster Prevention Map. Miyakonojo, Kogen Town, Kobayashi City, Ebino City, Yusui Town, Shima City, Fuo City.