
Advanced Search for Maps
Showing 21-30 of 70
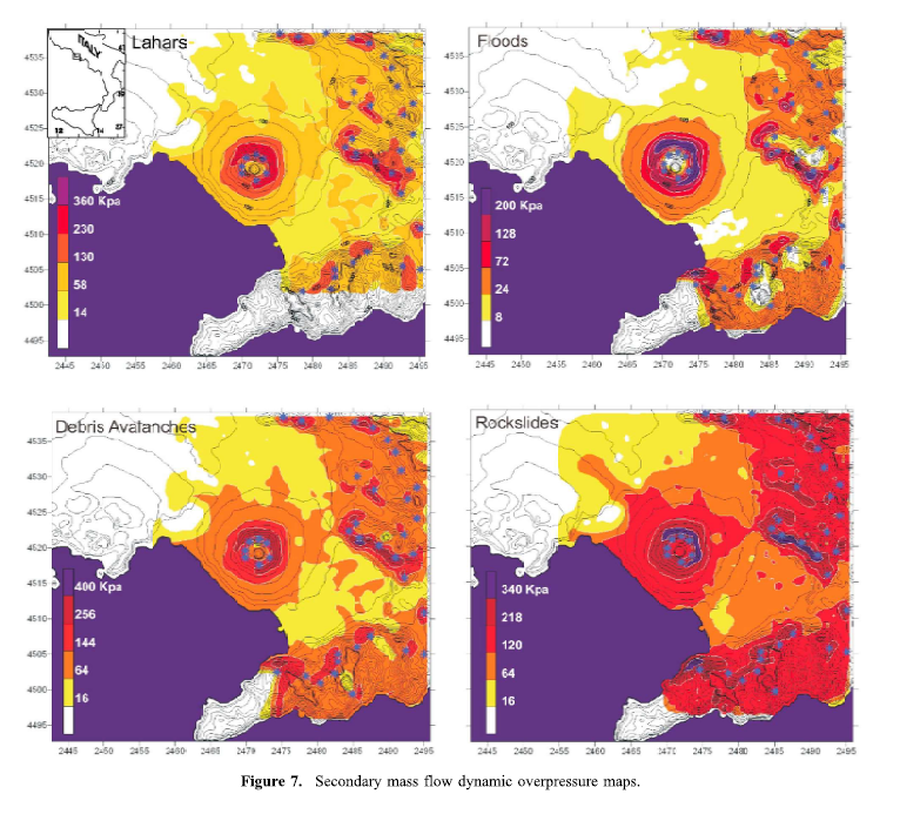
Figure in a journal article
Lahars, Floods, Debris Avalanches, Rockslides
Figure 7 in: Mastrolorenzo, G., & Pappalardo, L. (2010). Hazard assessment of explosive volcanism at Somma‐Vesuvius. Journal of Geophysical Research: Solid Earth, 115(B12). https://doi.org/10.1029/2009JB006871
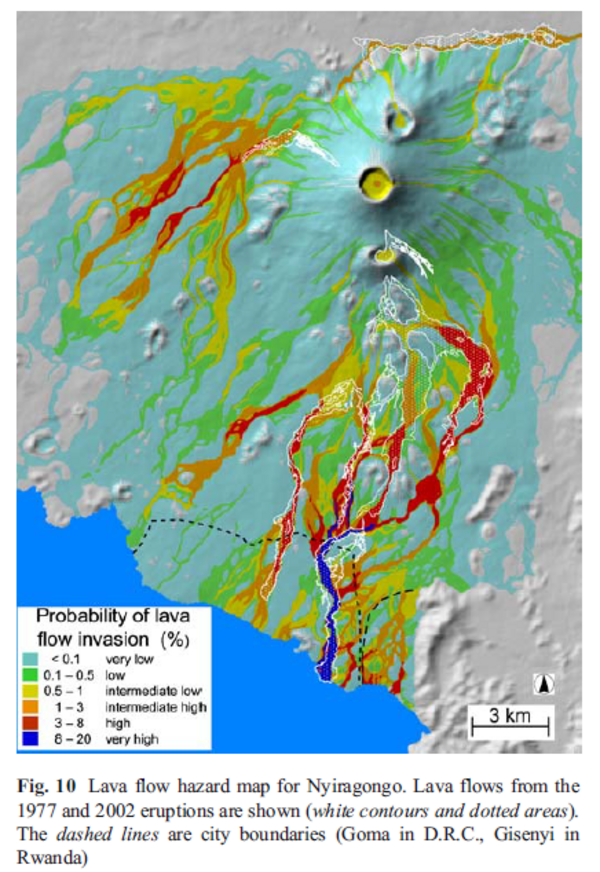
Figure in a journal article
Lava flow hazard map for Nyiragongo
Figure 10 in: Favalli, M., Chirico, G. D., Papale, P., Pareschi, M. T., & Boschi, E. (2009). Lava flow hazard at Nyiragongo volcano, DRC. Bulletin of volcanology, 71(4), p. 363-374. https://doi.org/10.1007/s00445-008-0233-y
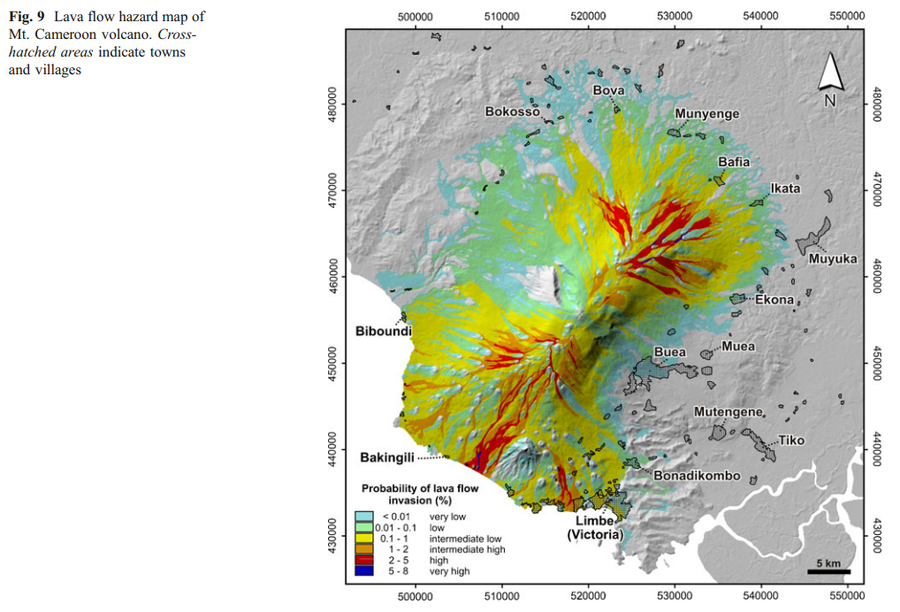
Figure in a journal article
Lava flow hazard map of Mt. Cameroon volcano
Figure 9 in: Favalli, M., Tarquini, S., Papale, P., Fornaciai, A., & Boschi, E. (2012). Lava flow hazard and risk at Mt. Cameroon volcano. Bulletin of Volcanology, 74(2), 423-439. https://doi.org/10.1007/s00445-011-0540-6
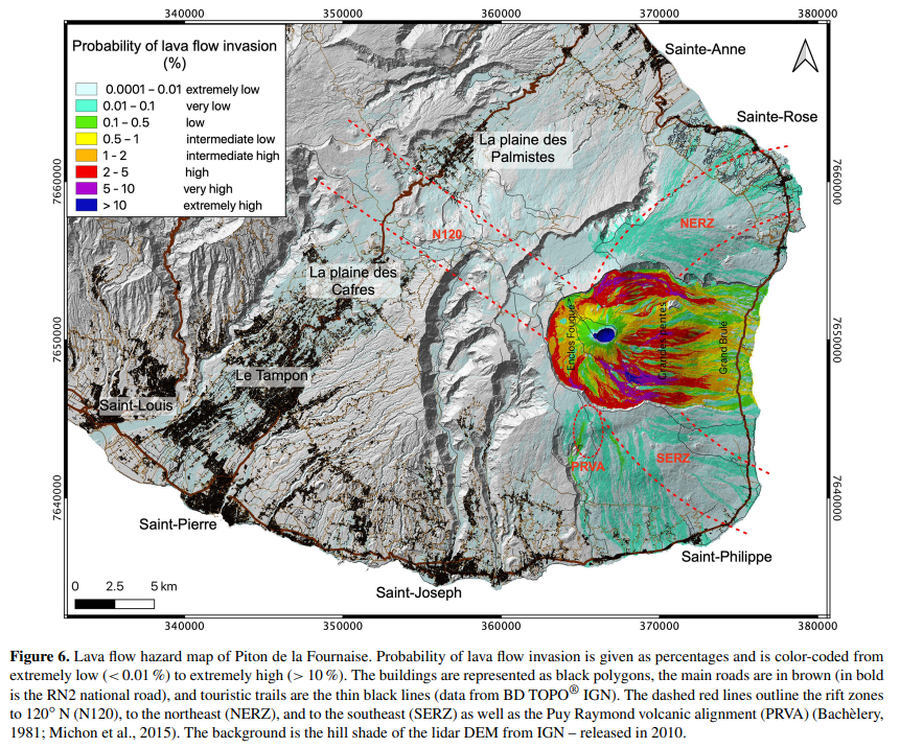
Figure in a journal article
Lava flow hazard map of Piton de la Fournaise
Figure 6 in: Chevrel, M. O., Favalli, M., Villeneuve, N., Harris, A. J., Fornaciai, A., Richter, N., Derrien, A., Di Muro, A., & Peltier, A. (2021). Lava flow hazard map of Piton de la Fournaise volcano. Natural Hazards and Earth System Sciences, 21(8), 2355-2377. https://doi.org/10.5194/nhess-21-2355-2021, 2021
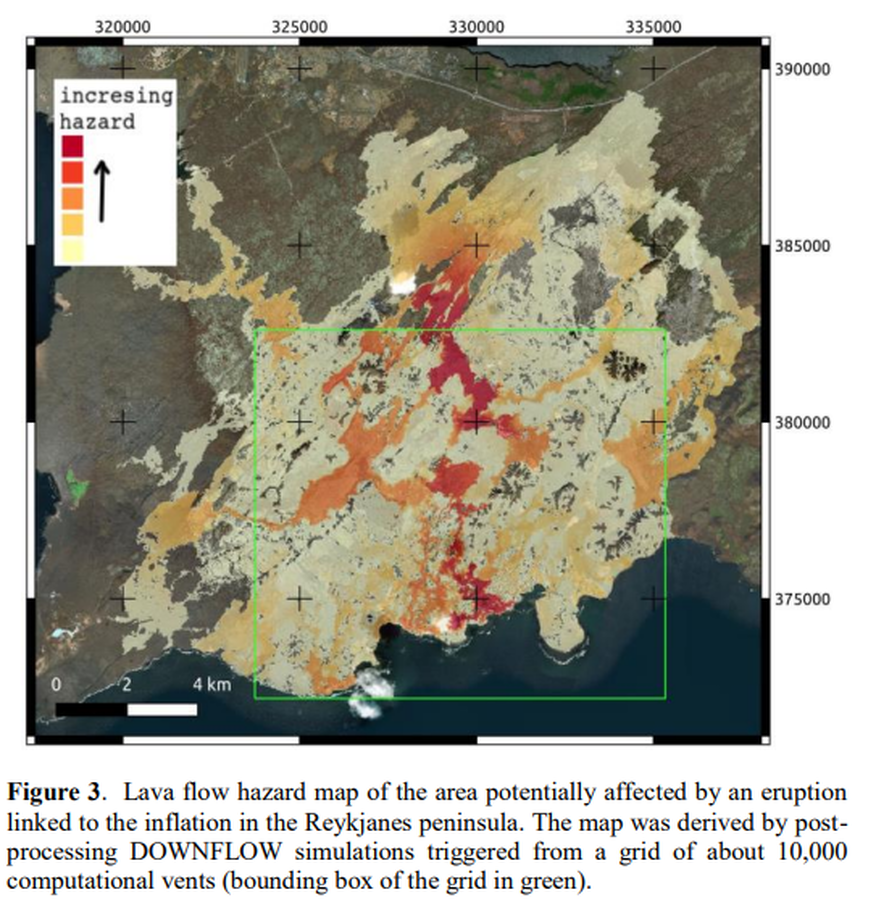
Figure in a conference presentation
Lava flow hazard map of the area potentially affected by an eruption linked to the inflation in the Reykjanes peninsula
Figure 3 in: Tarquini, S., Favalli, M., Pfeffer, M., de'Michieli Vitturi, M., Barsotti, S., Pedersen, G., Óladóttir, B., & Jensen, E. H. (2020). Assessing the impact of lava flows during the 2020 unrest of the Svartsengi volcanic system on the Reykjanes peninsula, Iceland. Geomorphometry, Perugia, Italy. https://doi.org/10.30437/GEOMORPHOMETRY2020
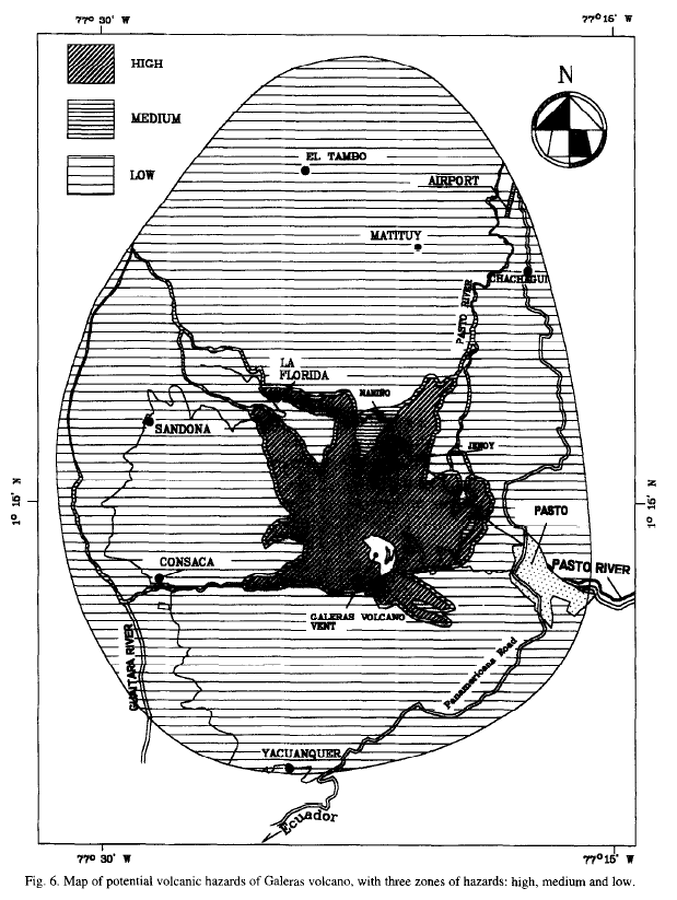
Official, Figure in a journal article
Map of potencial volcanic hazards of Galeras volcano, with three zones of hazards: high, medium and low
Figure 6 in: Artunduaga, A.D.H., & Jiménez, G.P.C. (1997). Third version of the hazard map of Galeras Volcano, Colombia. Journal of Volcanology and Geothermal research, 77(1-4), p. 89-100. https://doi.org/10.1016/S0377-0273(96)00088-1
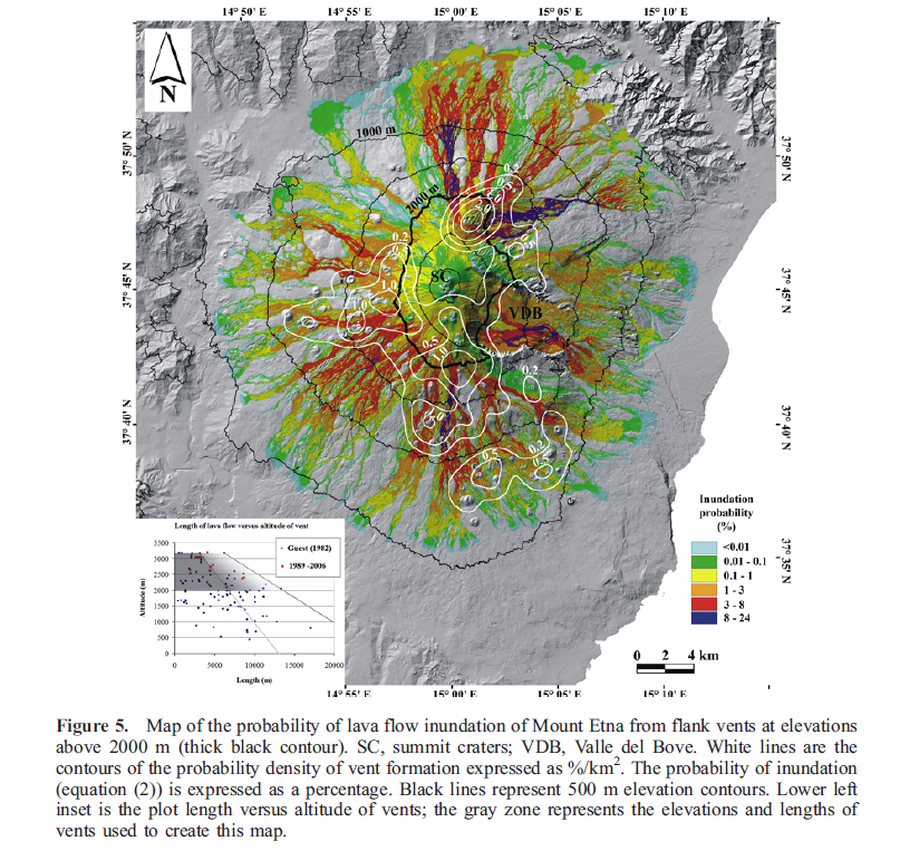
Figure in a journal article
Map of the probability of lava flow inundation of Mount Etna from flank vents at elevations above 2000 m
Figure 5 in: Favalli, M., Mazzarini, F., Pareschi, M. T., & Boschi, E. (2009). Topographic control on lava flow paths at Mount Etna, Italy: implications for hazard assessment. Journal of Geophysical Research: Earth Surface, 114(F1). https://doi.org/10.1029/2007JF000918

Figure in a journal article
Map of the probability of lava flow inundation of Mount Etna from flank vents at elevations above 2000 m calculated assuming a uniform probability of vent opening.
Figure 7 in: Favalli, M., Mazzarini, F., Pareschi, M. T., & Boschi, E. (2009). Topographic control on lava flow paths at Mount Etna, Italy: implications for hazard assessment. Journal of Geophysical Research: Earth Surface, 114(F1). https://doi.org/10.1029/2007JF000918
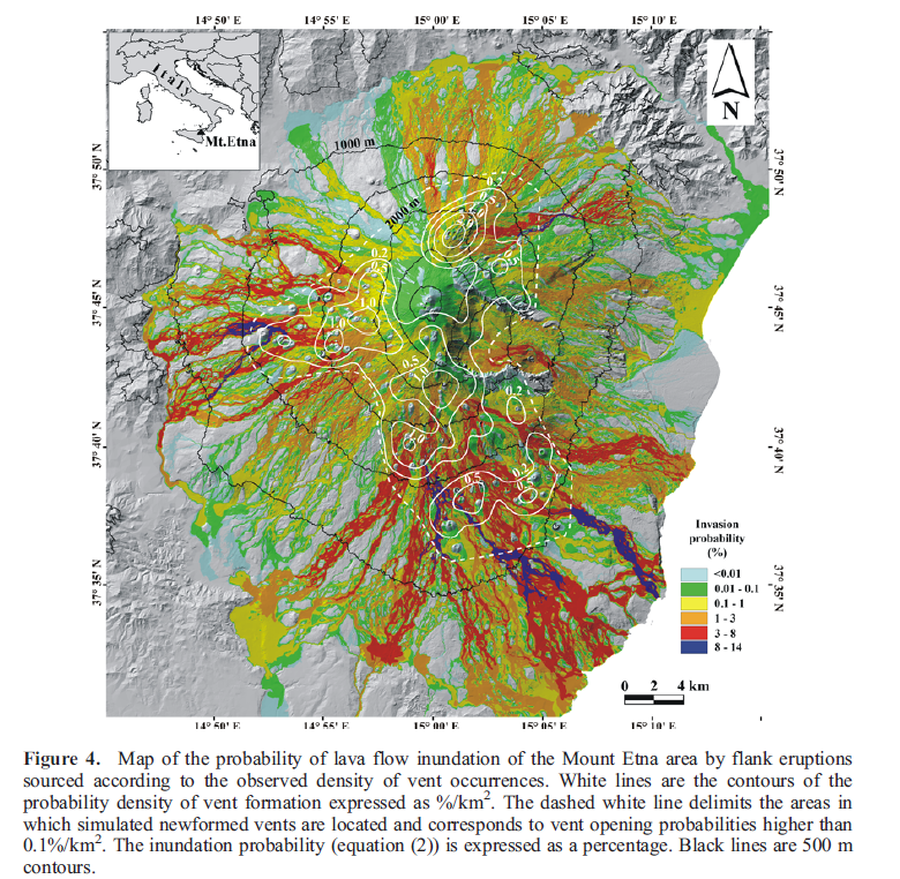
Figure in a journal article
Map of the probability of lava flow inundation of the Mount Etna area by flank eruptions sourced according to the observed density of vent occurrences
Figure 4 in: Favalli, M., Mazzarini, F., Pareschi, M. T., & Boschi, E. (2009). Topographic control on lava flow paths at Mount Etna, Italy: implications for hazard assessment. Journal of Geophysical Research: Earth Surface, 114(F1). https://doi.org/10.1029/2007JF000918
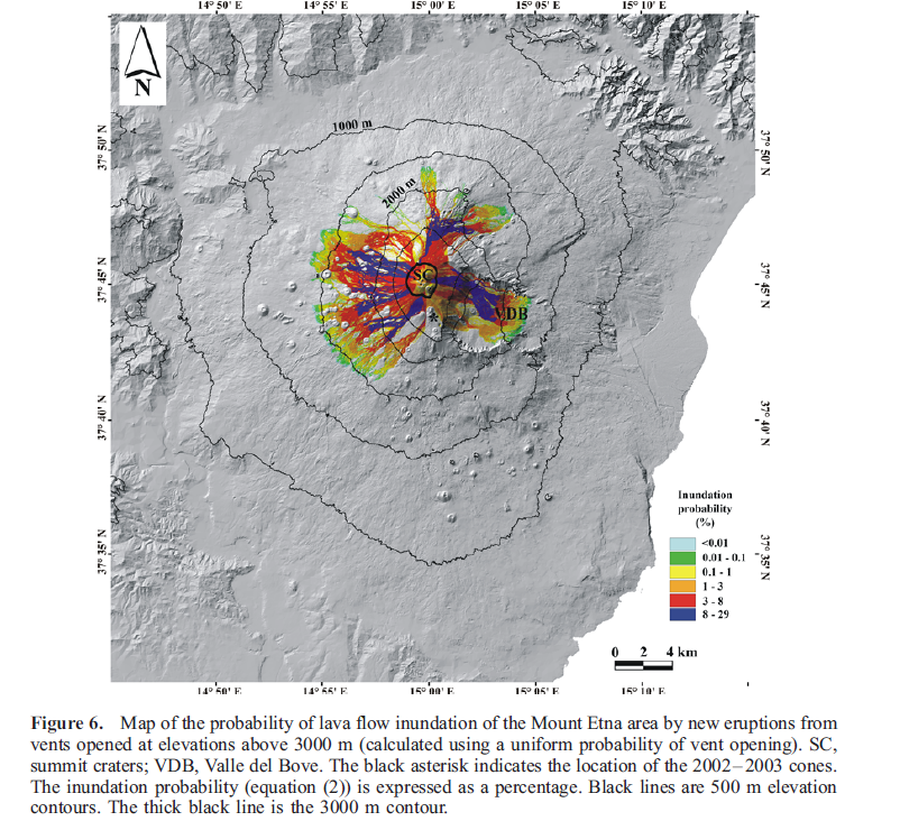
Figure in a journal article
Map of the probability of lava flow inundation of the Mount Etna area by new eruptions from vents opened at elevations above 3000 m (calculated using a uniform probability of vent opening)
Figure 6 in: Favalli, M., Mazzarini, F., Pareschi, M. T., & Boschi, E. (2009). Topographic control on lava flow paths at Mount Etna, Italy: implications for hazard assessment. Journal of Geophysical Research: Earth Surface, 114(F1). https://doi.org/10.1029/2007JF000918