
Advanced Search for Maps
Showing 11-20 of 56
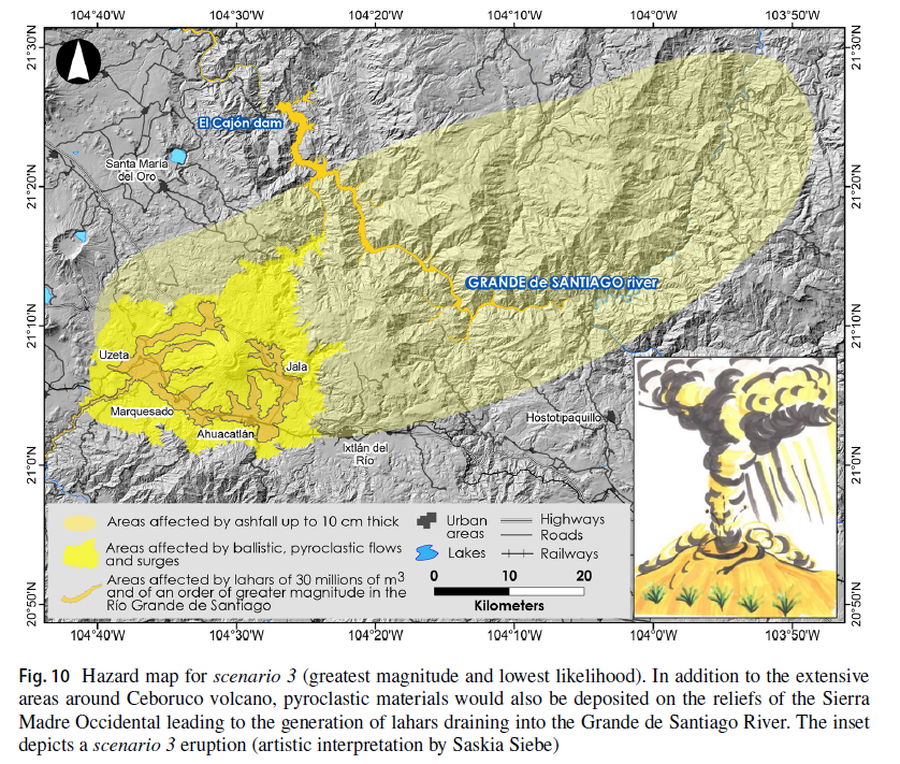
Figure in a journal article
Hazard map for scenario 3 (greatest magnitude and lowest likelihood)
Figure 10 in: Sieron, K., Ferrés, D., Siebe, C., Constantinescu, R., Capra, L., Connor, C., Connor, L., Groppelli, G. & Zuccolotto, K.G. (2019). Ceboruco hazard map: part II—modeling volcanic phenomena and construction of the general hazard map. Natural Hazards, 96(2), p. 893-933. https://doi.org/10.1007/s11069-019-03577-5
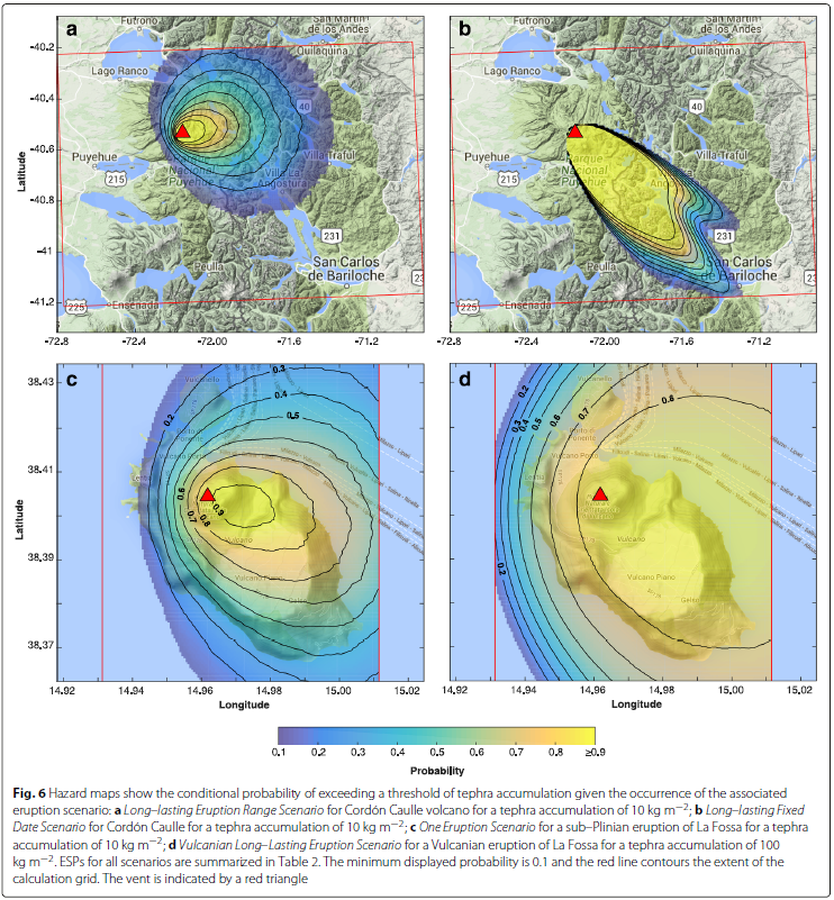
Figure in a journal article
Hazard maps show the conditional probability of exceeding a threshold of tephra accumulation given the occurrence of the associated eruption scenario
Figure 6 in: Biass, S., Bonadonna, C., Connor, L., & Connor, C. (2016). TephraProb: a Matlab package for probabilistic hazard assessments of tephra fallout. Journal of Applied Volcanology, 5(1), 1-16. https://doi.org/10.1186/s13617-016-0050-5
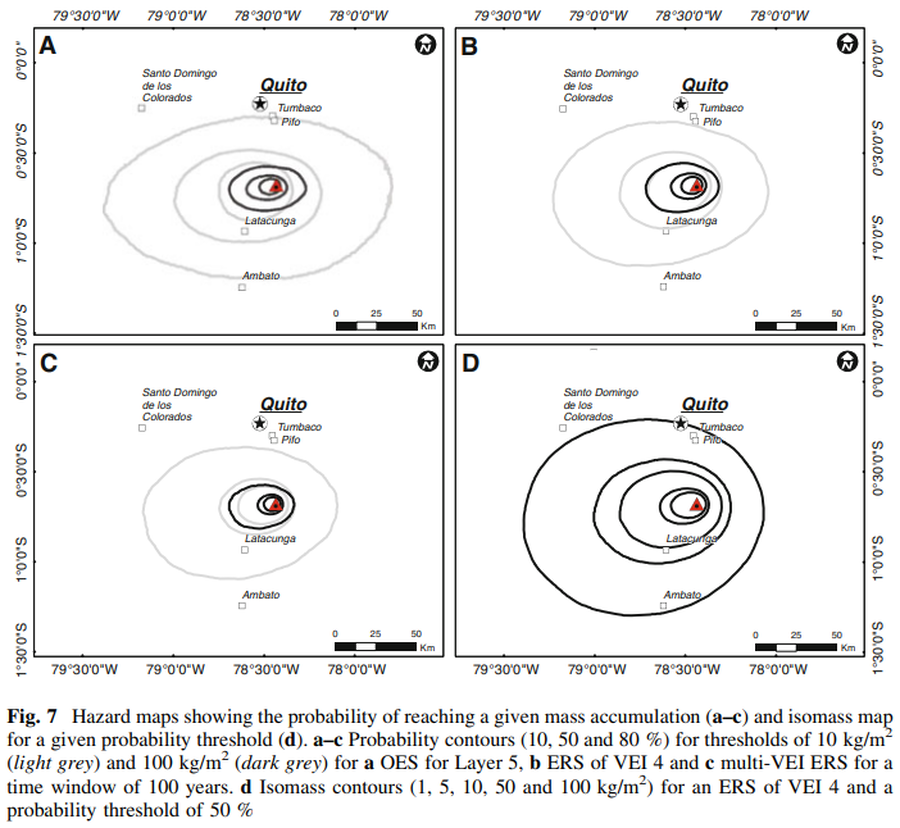
Figure in a journal article
Hazard maps showing the probability of reaching a given mass accumulation (a–c) and isomass map for a given probability threshold (d)
Figure 7 in: Biass, S., & Bonadonna, C. (2013). A fast GIS-based risk assessment for tephra fallout: the example of Cotopaxi volcano, Ecuador. Natural Hazards, 65, 477-495. https://doi.org/10.1007/s11069-012-0378-z
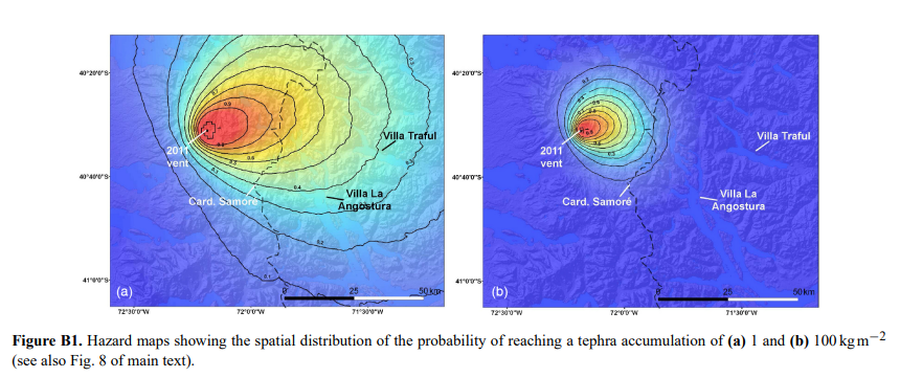
Figure in a journal article
Hazard maps showing the spatial distribution of the probability of reaching a tephra accumulation of (a) 1 and (b) 100 kg m−2
Figure B1 in: Elissondo, M., Baumann, V., Bonadonna, C., Pistolesi, M., Cioni, R., Bertagnini, A., Biass, S., Herrero, J.-C., & Gonzalez, R. (2016). Chronology and impact of the 2011 Cordón Caulle eruption, Chile. Natural Hazards and Earth System Sciences, 16(3), 675-704. https://doi.org/10.5194/nhess-16-675-2016, 2016
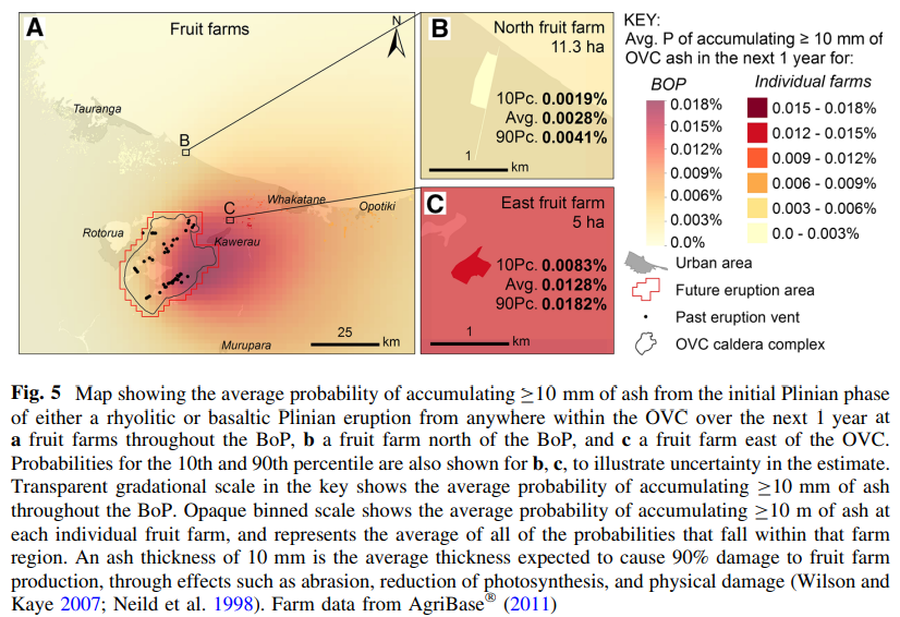
Figure in a journal article
Map showing the average probability of accumulating C10 mm of ash from the initial Plinian phase of either a rhyolitic or basaltic Plinian eruption from anywhere within the OVC over the next 1 year
Figure 5 in: Thompson, M. A., Lindsay, J. M., Wilson, T. M., Biass, S., & Sandri, L. (2017). Quantifying risk to agriculture from volcanic ashfall: a case study from the Bay of Plenty, New Zealand. Natural Hazards, 86(1), 31-56. https://doi.org/10.1007/s11069-016-2672-7
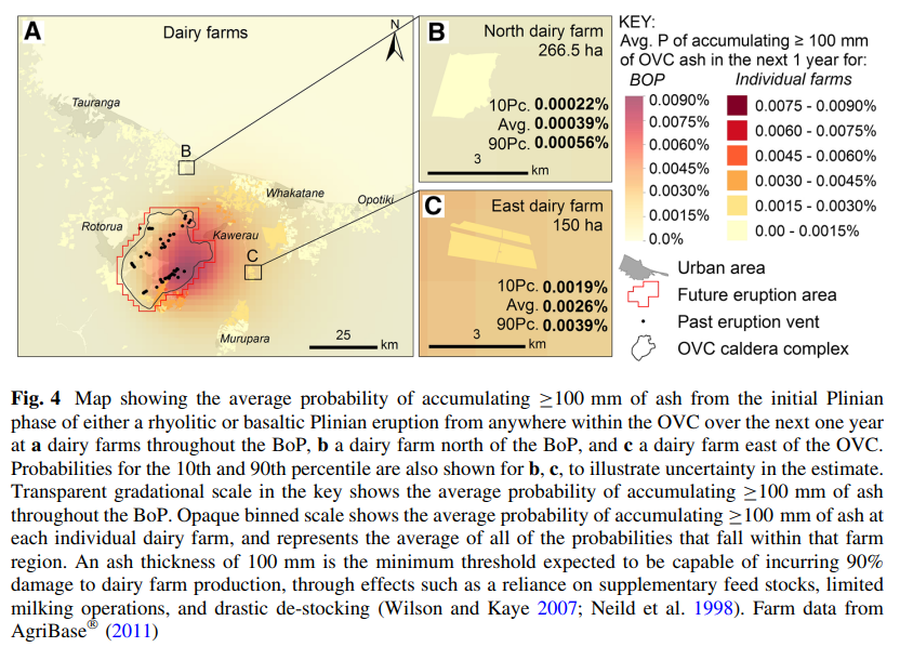
Figure in a journal article
Map showing the average probability of accumulating ≥100 mm of ash from the initial Plinian phase of either a rhyolitic or basaltic Plinian eruption from anywhere within the OVC over the next one year
Figure 4 in: Thompson, M. A., Lindsay, J. M., Wilson, T. M., Biass, S., & Sandri, L. (2017). Quantifying risk to agriculture from volcanic ashfall: a case study from the Bay of Plenty, New Zealand. Natural Hazards, 86(1), 31-56. https://doi.org/10.1007/s11069-016-2672-7
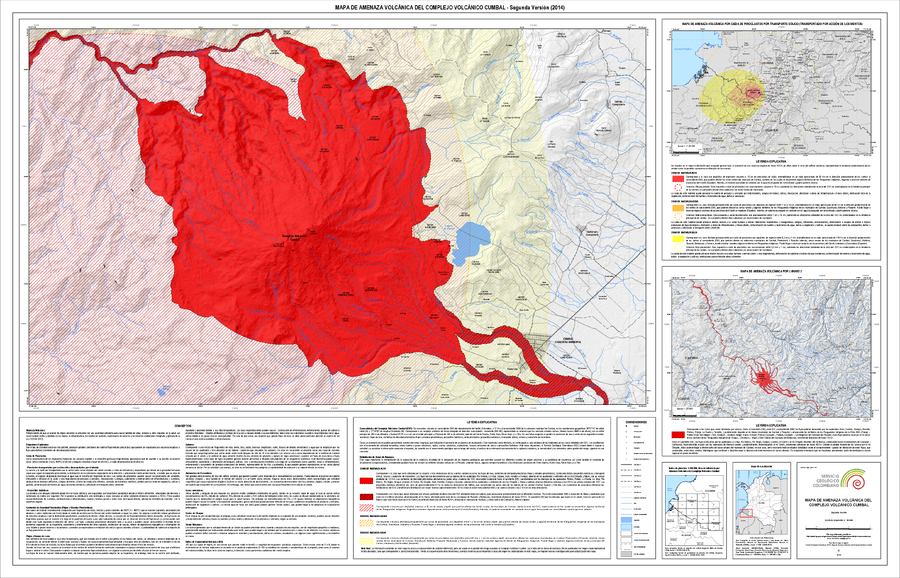
Official, Insert/poster-size map with accompanying report
Mapa de Amenaza Volcánica del Complejo Volcánico Cumbal -- Segunda Versión (2014)
(Volcanic Hazard Map of the Cumbal Volcanic Complex -- Second Version (2014))
Servicio Geológico Colombiano (SGC). (2014). Mapa de Amenaza Volcánica del Complejo Volcánico Cumbal. Segunda Version.
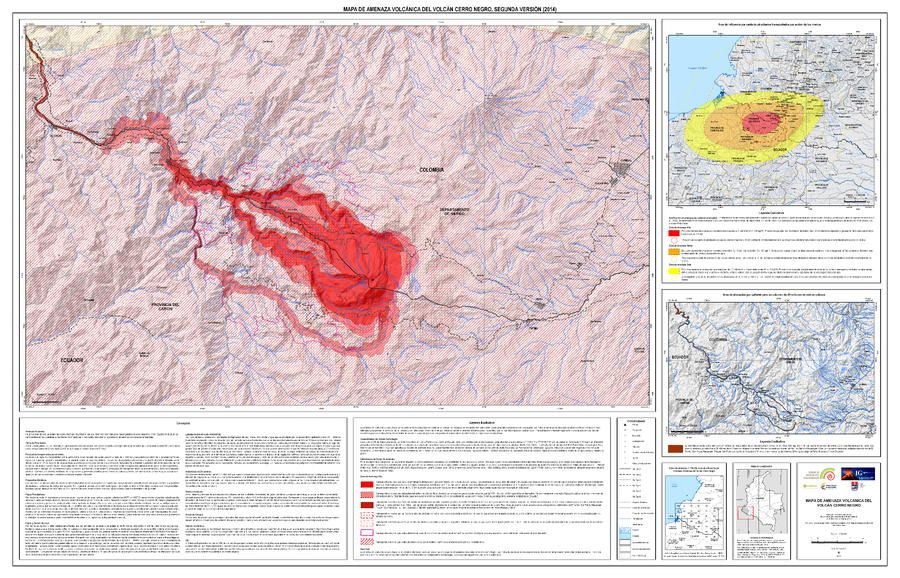
Official, Map sheet or poster
Mapa de Amenaza Volcánica del Volcán Cerro Negro, Segunda Versión (2014)
(Volcanic Hazard Map of Cerro Negro Volcano, Second Version (2014))
Servicio Geológico Colombiano (SGC). (2014). Mapa de Amenaza V olcánica del Volcán Cerro Negro, Segunda Versión. escala 1:50,000.
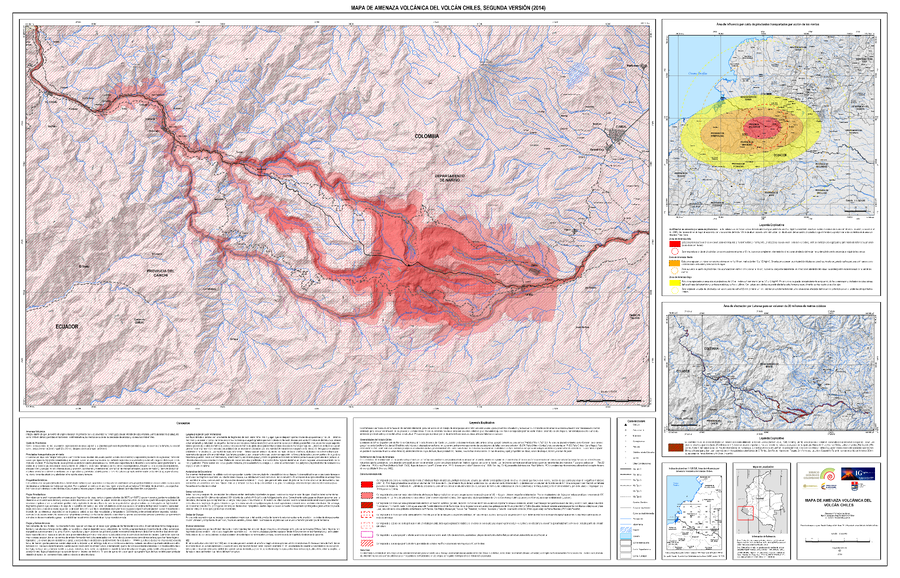
Official, Map sheet or poster
Mapa de Amenaza Volcánica del Volcán Chiles, Segunda Versión (2014)
(Volcanic Hazard Map of Chiles Volcano, Second Edition (2014))
Servicio Geológico Colombiano (SGC). (2014). Mapa de Amenaza Volcánica del Volcán Chiles, Sugunda Versión. escala 1:50,000.
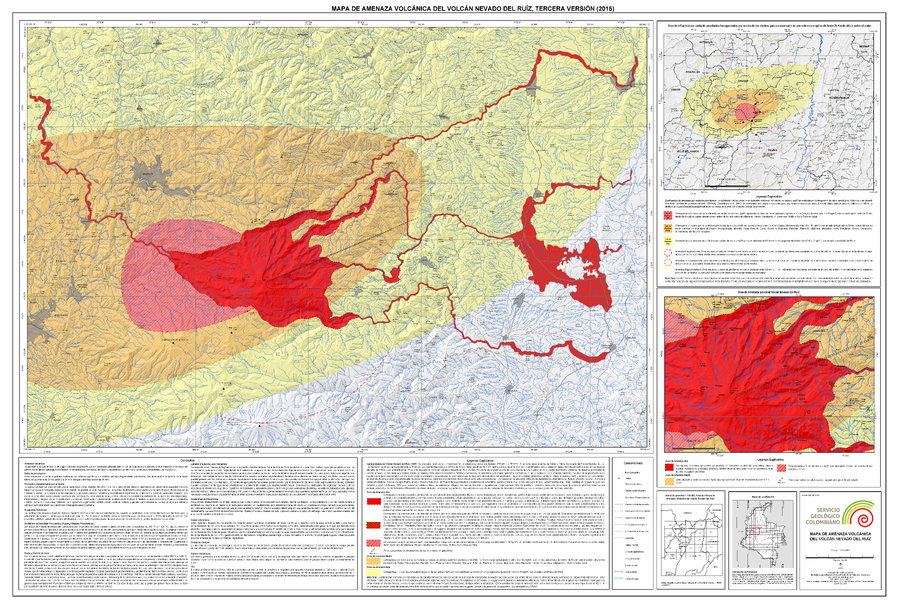
Official, Map sheet or poster
Mapa de Amenaza Volcánica del Volcán Nevado del Ruiz, Tercera Versión (2015)
(Volcanic Hazard Map of Nevado del Ruiz Volcano, Third Version (2015))
Servicio Geológico Colombiano (SGC). (2015). Mapa de Amenaza Volcánica del Volcán Nevado del Ruiz, Tercera Version. mapa escala 1:120,000. Bogota.