
Advanced Search for Maps
Showing 21-30 of 56
Official, Insert/poster-size map with accompanying report
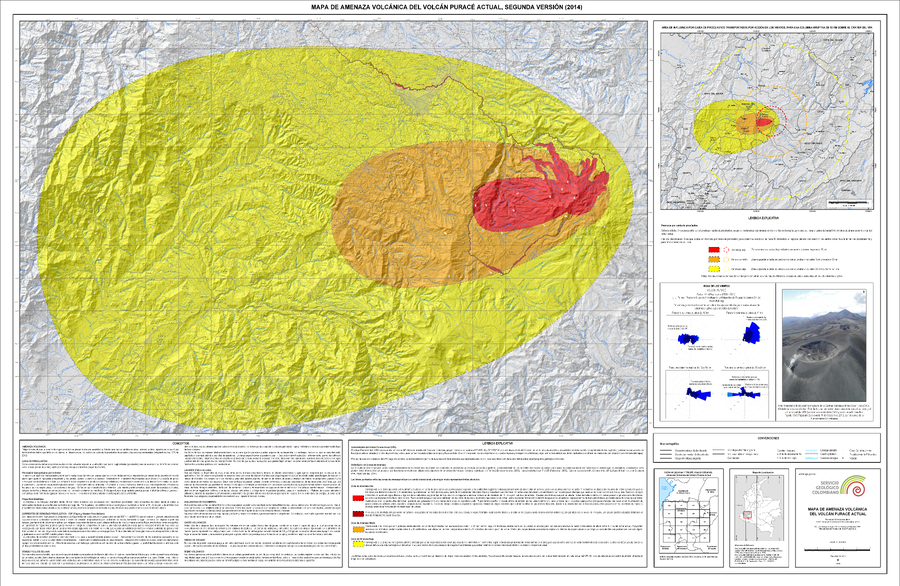
Mapa de Amenaza Volcánica del Volcán Puracé Actual, Segunda Versión 2014
(Volcanic Hazard Map of the Current Puracé Volcano, Second Version 2014)
Appendix A in: Monsalve, M.L., Galarza, J.J., Zuluaga, I., & Laverde, C.A. (2014). Mapa de Amenaza Volcanica Purace Actual (Cuaca-Colombia), Segunda Version. Servicio Geologico Colombiano (SGC), Bogotá

Official, Insert/poster-size map with accompanying report
Mapa de Amenaza Volcánica del Volcán Sotará - Primera versión 2019
(Volcanic Hazard Map of the Sotara Volcano - First version 2019)
Servicio Geológico Colombiano (SGC). (2019). Mapa de Amenaza Volcánica del Volcán Sotará. Primera versión.
Official, Map sheet or poster
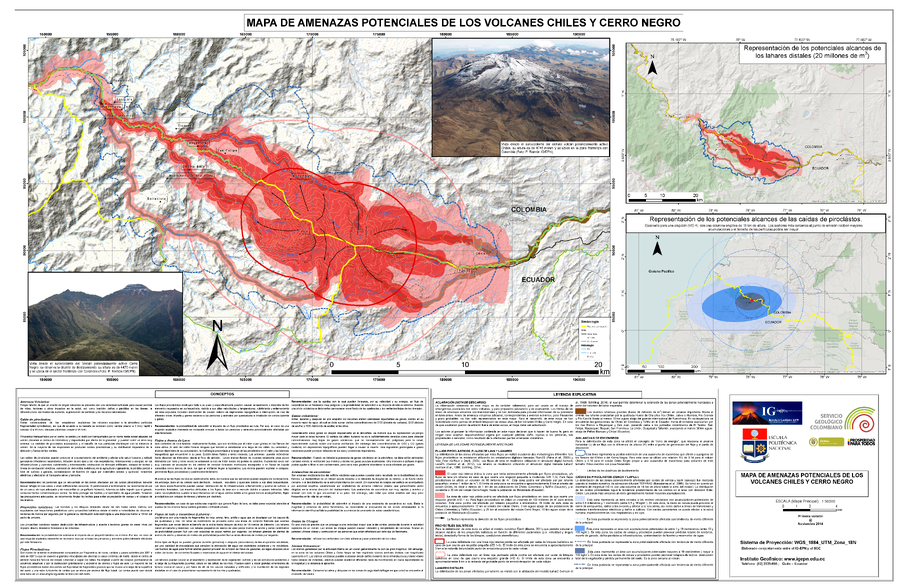
Mapa de Amenazas Potenciales de los Volcanes Chiles y Cerro Negro
(Map of Potential Hazards of Chiles y Cerro Negro Volcanos)
Servicio Geológco Colombiano (SGC) & Instituto Geofísico de la Escuela Politécnica Nacional (IG-EPN). (2014). Mapa de Amenazas Potenciales de los Volcanes Chiles Y Cerro Negro.
Official, Figure in hazard assessment
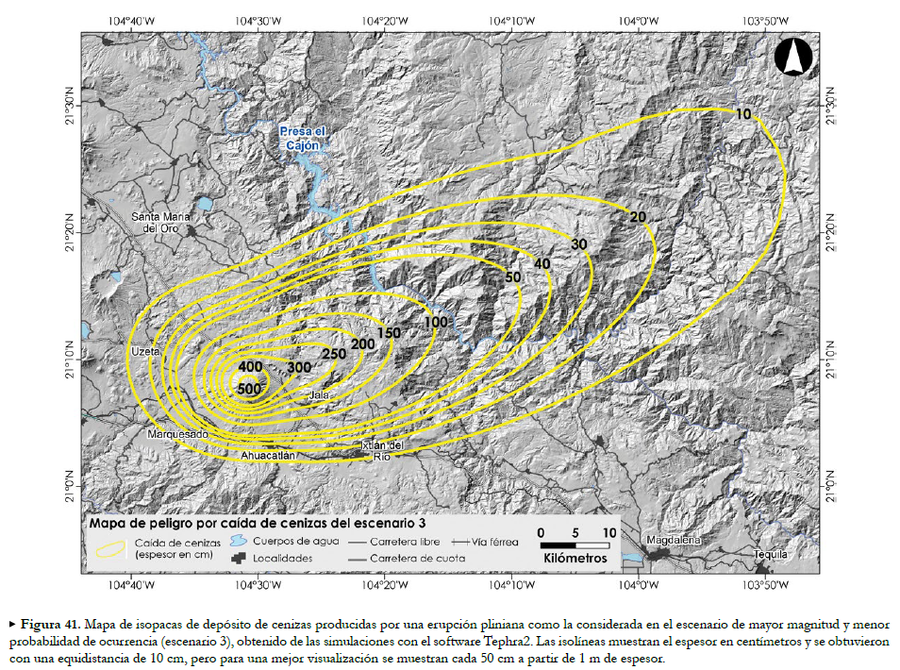
Mapa de peligro por caída de cenizas del escenario 3
(Scenario 3 ash fall hazard map)
Figure 41 in: Ferrés López, D., Sieron, K., González Zuccolotto, K., Constantinescu, R., Agustín Flores, J., Siebe Grabach, C., Capra Pedol, L., Connor, L., & Connor, C.B. (2019). Memoria técnica del mapa de peligros del volcán Ceboruco (Nayarit). Monografías del Instituto de Geofísica, 24.
Official, Figure in hazard assessment
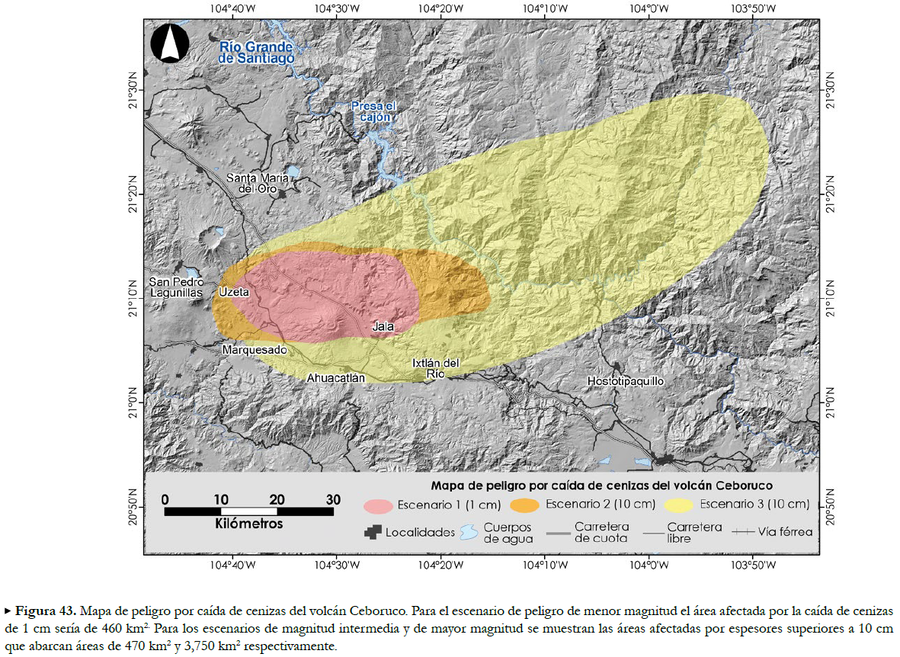
Mapa de peligro por caída de cenizas del volcán Ceboruco
(Ash fall hazard map for Ceboruco volcano)
Figure 43 in: Ferrés López, D., Sieron, K., González Zuccolotto, K., Constantinescu, R., Agustín Flores, J., Siebe Grabach, C., Capra Pedol, L., Connor, L., & Connor, C.B. (2019). Memoria técnica del mapa de peligros del volcán Ceboruco (Nayarit). Monografías del Instituto de Geofísica, 24.
Official, Map sheet or poster
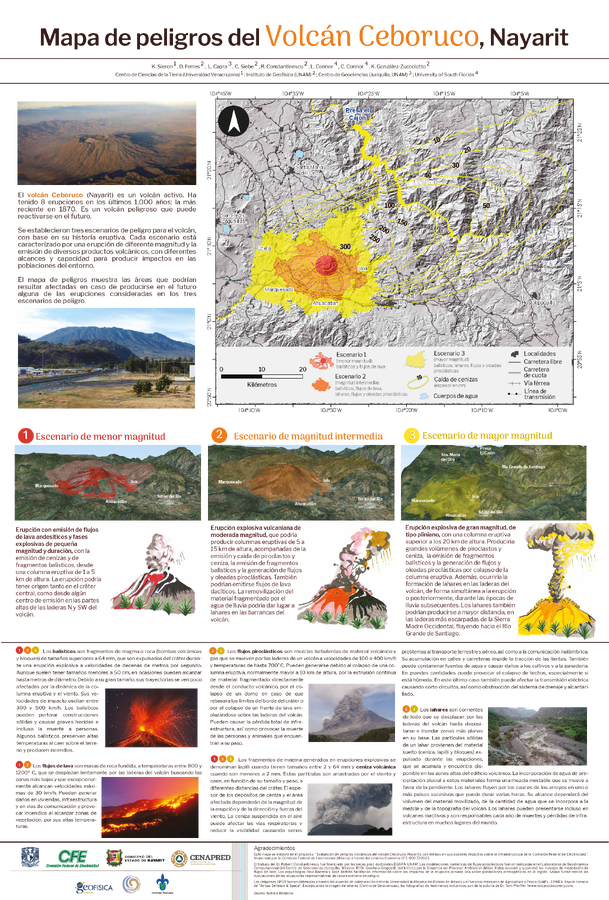
Mapa de peligros del Volcán Ceboruco, Nayarit
(Hazard map of Ceboruco Volcano, Nayarit)
Sieron, K., Ferrés, D., Capra, L., Siebe, C., Constantinescu, R., Connor, L., Connor, C., & González-Zuccolotto, K. (2019). Mapa de peligros del Volcán Ceboruco, Nayarit.

Official, Map sheet or poster
Mapas de los Peligros Potenciales del Volcán Reventador
(Maps of the Potential Hazards of Reventador Volcano)
Bourquin, J., Samaniego, P., Ramón, P., Bonadonna, C., Kelfoun, K., Vallejo, S., Hall, P., Mothes, P., LePennec, J.L., & Yepes, H. (2011). Mapas de los Peligros Potenciales del Volcán Reventador. Instituto Geofisico de la Escuela Politecnica Nacional (IG-EPN), Instituto de Recherche pour le Dévoloppement (IRD), & Universidad de Ginebra, Centre d’Etude des Risques Géologiques (CERG). Quito.
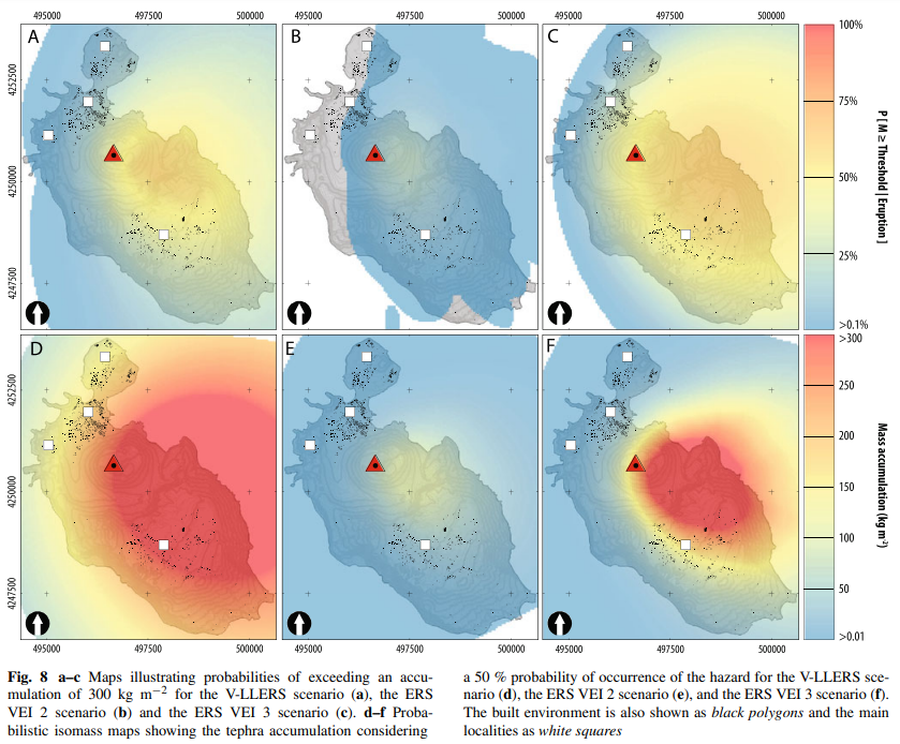
Figure in a journal article
Maps illustrating probabilities of exceeding an accumulation of 300 kg m−2 for the V-LLERS scenario. Probabilistic isomass maps showing the tephra accumulation considering a 50 % probability of occurrence of the hazard for the V-LLERS scenario.
Figure 8 in: Biass, S., Bonadonna, C., Di Traglia, F., Pistolesi, M., Rosi, M., & Lestuzzi, P. (2016). Probabilistic evaluation of the physical impact of future tephra fallout events for the Island of Vulcano, Italy. Bulletin of Volcanology, 78(5), 1-22. https://doi.org/10.1007/s00445-016-1028-1
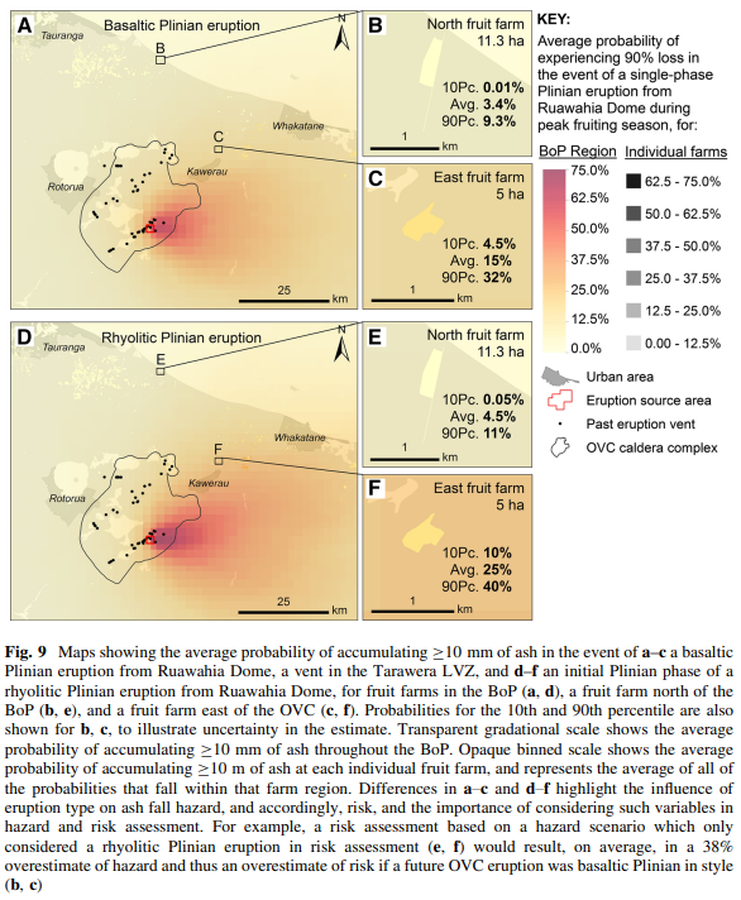
Figure in a journal article
Maps showing the average probability of accumulating ≥10 mm of ash in the event of a–c a basaltic Plinian eruption from Ruawahia Dome, a vent in the Tarawera LVZ, and d–f an initial Plinian phase of a rhyolitic Plinian eruption from Ruawahia Dome, for fruit farms in the BoP
Figure 9 in: Thompson, M. A., Lindsay, J. M., Wilson, T. M., Biass, S., & Sandri, L. (2017). Quantifying risk to agriculture from volcanic ashfall: a case study from the Bay of Plenty, New Zealand. Natural Hazards, 86(1), 31-56. https://doi.org/10.1007/s11069-016-2672-7
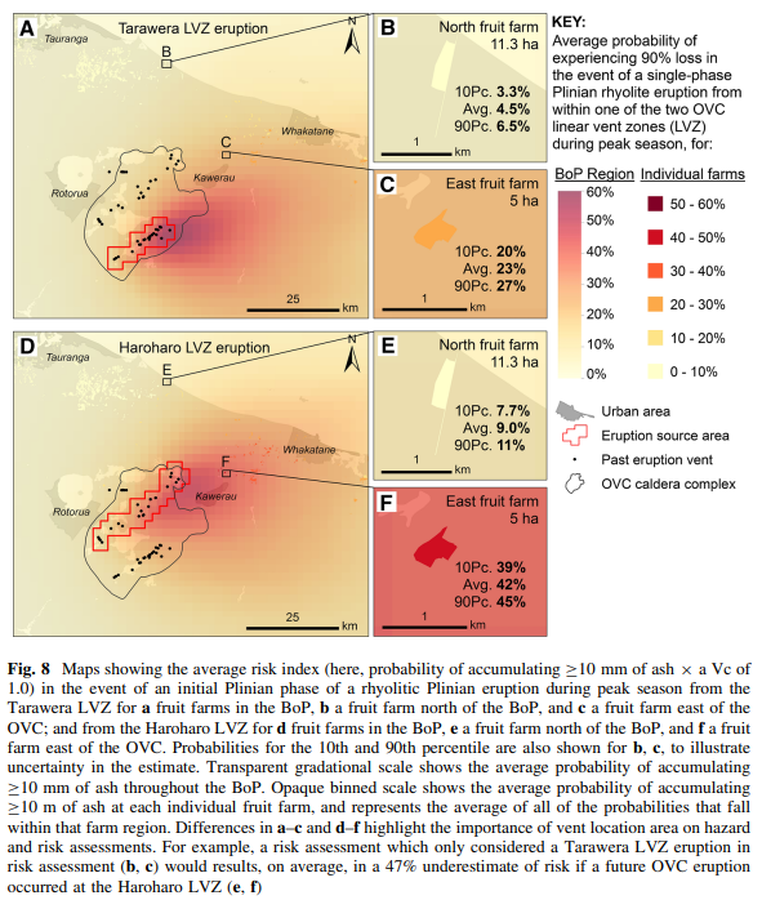
Figure in a journal article
Maps showing the average risk index (here, probability of accumulating ≥10 mm of ash × a Vc of 1.0) in the event of an initial Plinian phase of a rhyolitic Plinian eruption during peak season from the Tarawera LVZ for a fruit farms in the BoP
Figure 8 in: Thompson, M. A., Lindsay, J. M., Wilson, T. M., Biass, S., & Sandri, L. (2017). Quantifying risk to agriculture from volcanic ashfall: a case study from the Bay of Plenty, New Zealand. Natural Hazards, 86(1), 31-56. https://doi.org/10.1007/s11069-016-2672-7