
Advanced Search for Maps
Showing 11-20 of 22
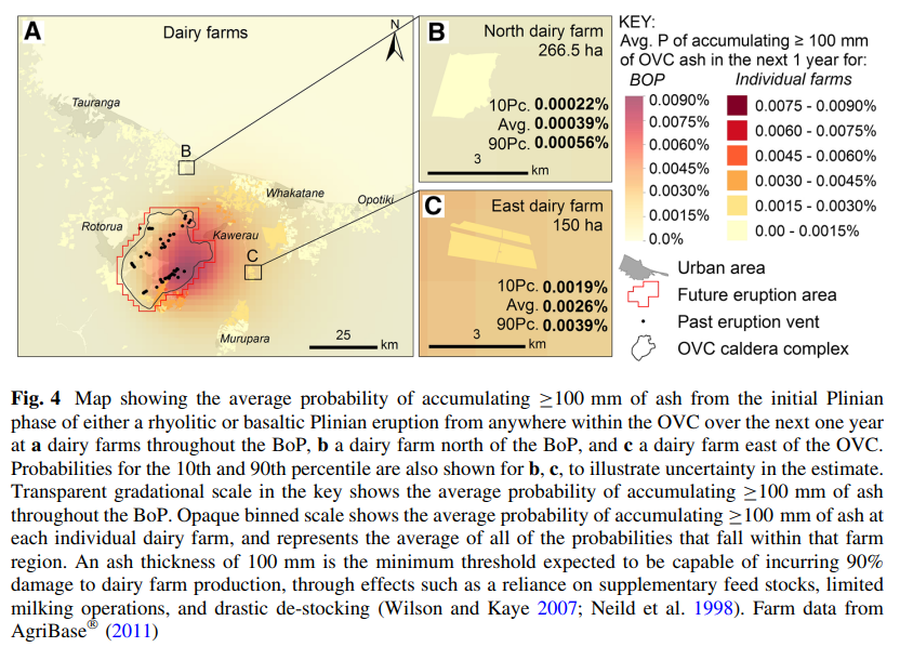
Figure in a journal article
Map showing the average probability of accumulating ≥100 mm of ash from the initial Plinian phase of either a rhyolitic or basaltic Plinian eruption from anywhere within the OVC over the next one year
Figure 4 in: Thompson, M. A., Lindsay, J. M., Wilson, T. M., Biass, S., & Sandri, L. (2017). Quantifying risk to agriculture from volcanic ashfall: a case study from the Bay of Plenty, New Zealand. Natural Hazards, 86(1), 31-56. https://doi.org/10.1007/s11069-016-2672-7

Official, Insert/poster-size map with accompanying report
Mapa de Amenaza Volcánica del Volcán Sotará - Primera versión 2019
(Volcanic Hazard Map of the Sotara Volcano - First version 2019)
Servicio Geológico Colombiano (SGC). (2019). Mapa de Amenaza Volcánica del Volcán Sotará. Primera versión.
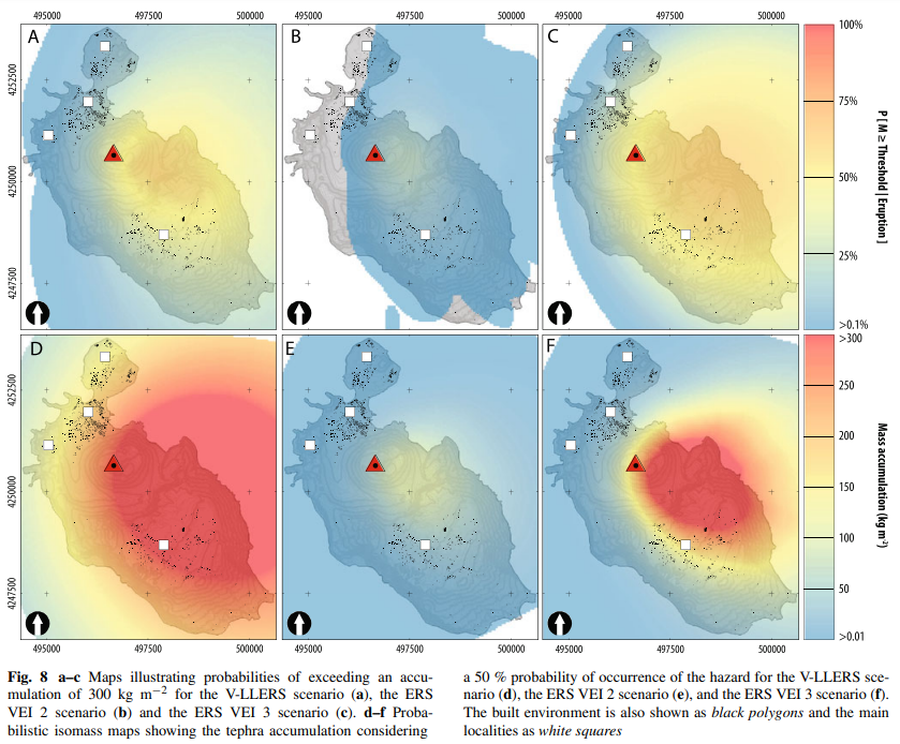
Figure in a journal article
Maps illustrating probabilities of exceeding an accumulation of 300 kg m−2 for the V-LLERS scenario. Probabilistic isomass maps showing the tephra accumulation considering a 50 % probability of occurrence of the hazard for the V-LLERS scenario.
Figure 8 in: Biass, S., Bonadonna, C., Di Traglia, F., Pistolesi, M., Rosi, M., & Lestuzzi, P. (2016). Probabilistic evaluation of the physical impact of future tephra fallout events for the Island of Vulcano, Italy. Bulletin of Volcanology, 78(5), 1-22. https://doi.org/10.1007/s00445-016-1028-1
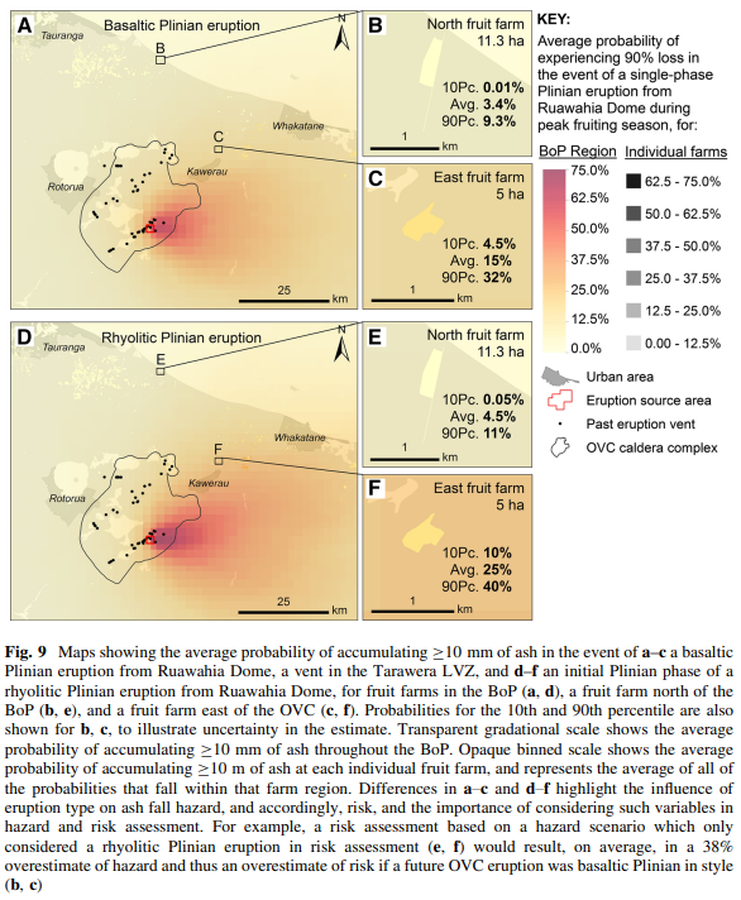
Figure in a journal article
Maps showing the average probability of accumulating ≥10 mm of ash in the event of a–c a basaltic Plinian eruption from Ruawahia Dome, a vent in the Tarawera LVZ, and d–f an initial Plinian phase of a rhyolitic Plinian eruption from Ruawahia Dome, for fruit farms in the BoP
Figure 9 in: Thompson, M. A., Lindsay, J. M., Wilson, T. M., Biass, S., & Sandri, L. (2017). Quantifying risk to agriculture from volcanic ashfall: a case study from the Bay of Plenty, New Zealand. Natural Hazards, 86(1), 31-56. https://doi.org/10.1007/s11069-016-2672-7
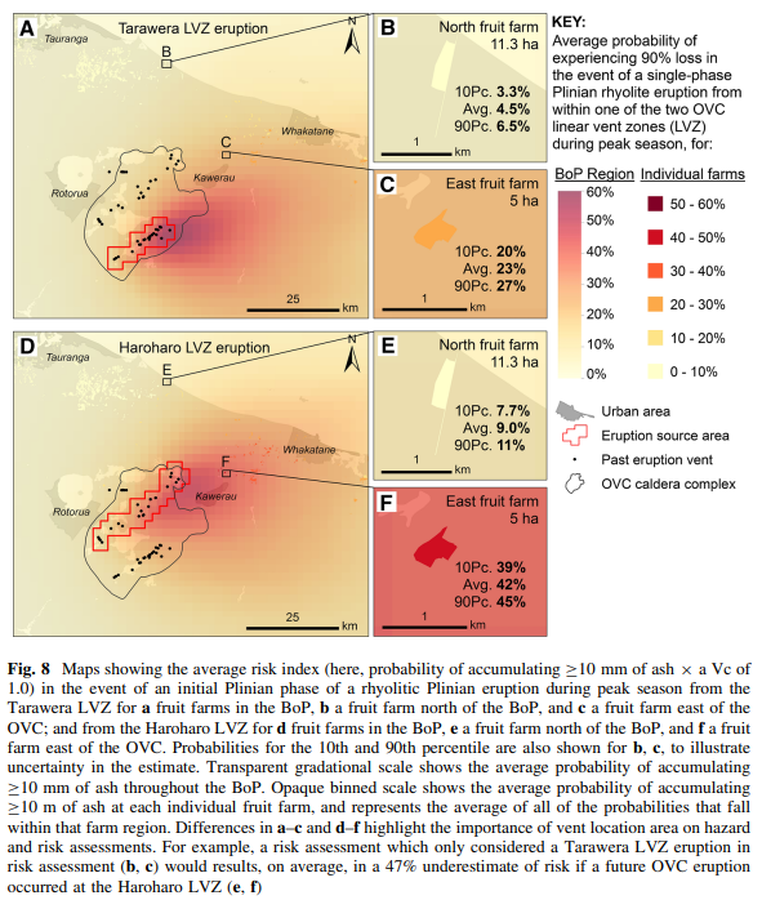
Figure in a journal article
Maps showing the average risk index (here, probability of accumulating ≥10 mm of ash × a Vc of 1.0) in the event of an initial Plinian phase of a rhyolitic Plinian eruption during peak season from the Tarawera LVZ for a fruit farms in the BoP
Figure 8 in: Thompson, M. A., Lindsay, J. M., Wilson, T. M., Biass, S., & Sandri, L. (2017). Quantifying risk to agriculture from volcanic ashfall: a case study from the Bay of Plenty, New Zealand. Natural Hazards, 86(1), 31-56. https://doi.org/10.1007/s11069-016-2672-7
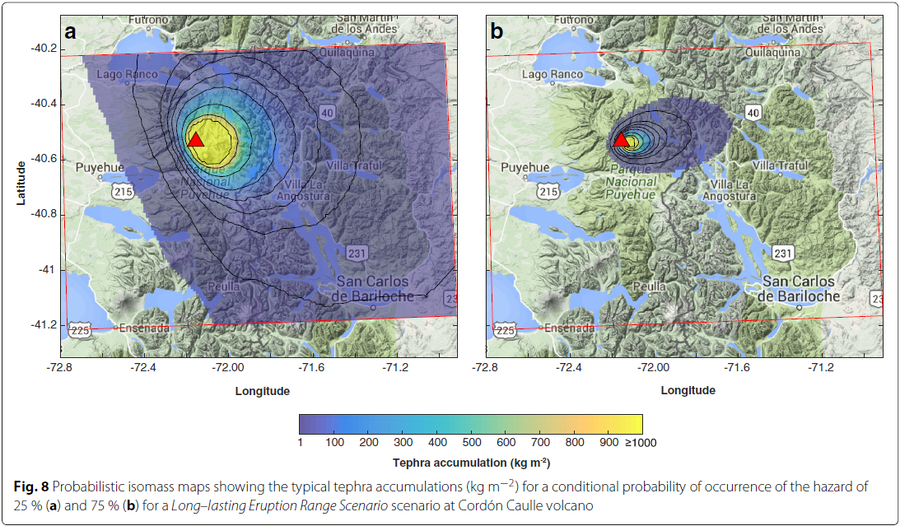
Figure in a journal article
Probabilistic isomass maps showing the typical tephra accumulations (kg m−2) for a conditional probability of occurrence of the hazard
Figure 8 in: Biass, S., Bonadonna, C., Connor, L., & Connor, C. (2016). TephraProb: a Matlab package for probabilistic hazard assessments of tephra fallout. Journal of Applied Volcanology, 5(1), 1-16. https://doi.org/10.1186/s13617-016-0050-5
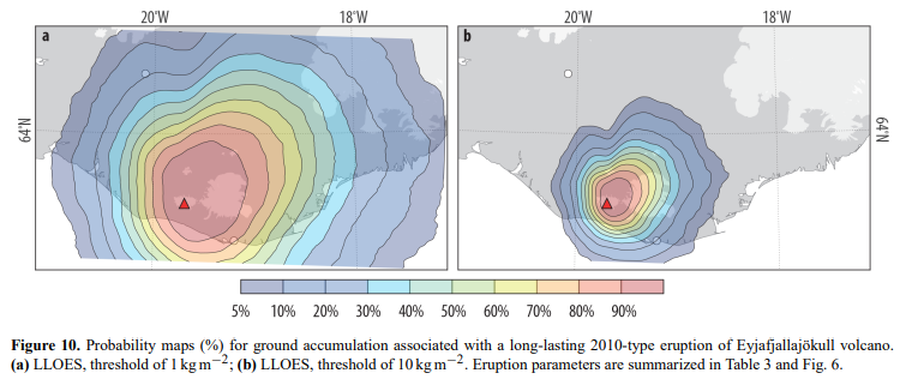
Figure in a journal article
Probability maps (%) for ground accumulation associated with a long-lasting 2010-type eruption of Eyjafjallajökull volcano
Figure 10 in: Biass, S., Scaini, C., Bonadonna, C., Folch, A., Smith, K., & Höskuldsson, A. (2014). A multi-scale risk assessment for tephra fallout and airborne concentration from multiple Icelandic volcanoes–Part 1: Hazard assessment. Natural hazards and earth system sciences, 14(8), 2265-2287. https://doi.org/10.5194/nhess-14-2265-2014
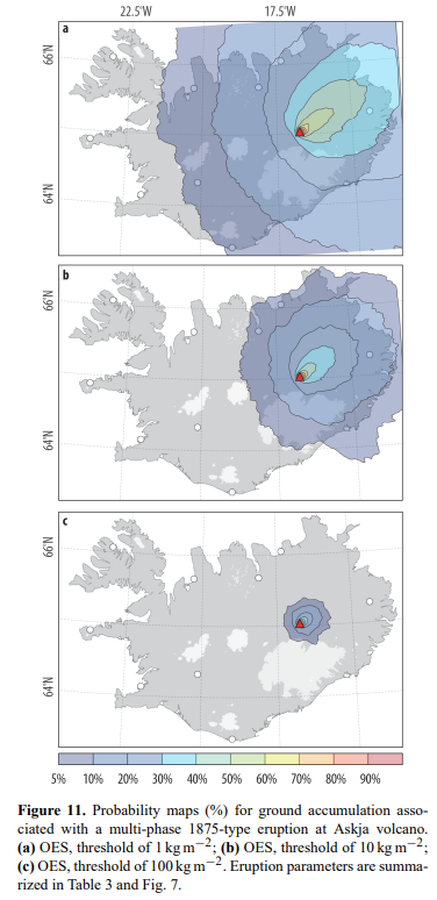
Figure in a journal article
Probability maps (%) for ground accumulation associated with a multi-phase 1875-type eruption at Askja volcano
Figure 11 in: Biass, S., Scaini, C., Bonadonna, C., Folch, A., Smith, K., & Höskuldsson, A. (2014). A multi-scale risk assessment for tephra fallout and airborne concentration from multiple Icelandic volcanoes–Part 1: Hazard assessment. Natural hazards and earth system sciences, 14(8), 2265-2287. https://doi.org/10.5194/nhess-14-2265-2014
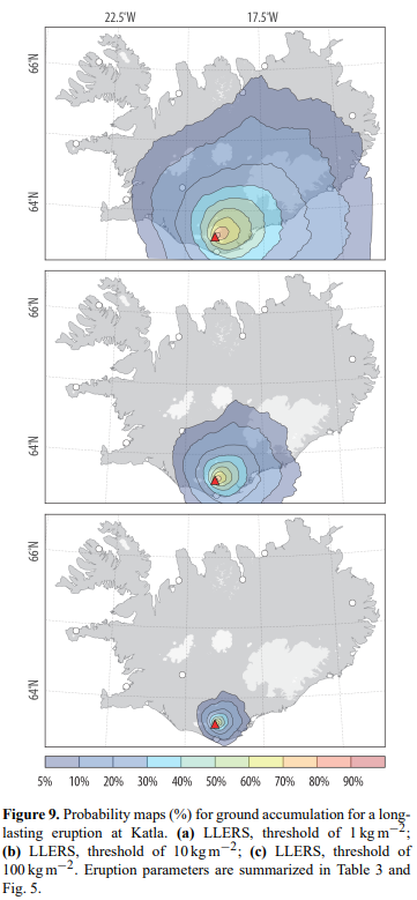
Figure in a journal article
Probability maps (%) for ground accumulation for a longlasting eruption at Katla
Figure 9 in: Biass, S., Scaini, C., Bonadonna, C., Folch, A., Smith, K., & Höskuldsson, A. (2014). A multi-scale risk assessment for tephra fallout and airborne concentration from multiple Icelandic volcanoes–Part 1: Hazard assessment. Natural hazards and earth system sciences, 14(8), 2265-2287. https://doi.org/10.5194/nhess-14-2265-2014
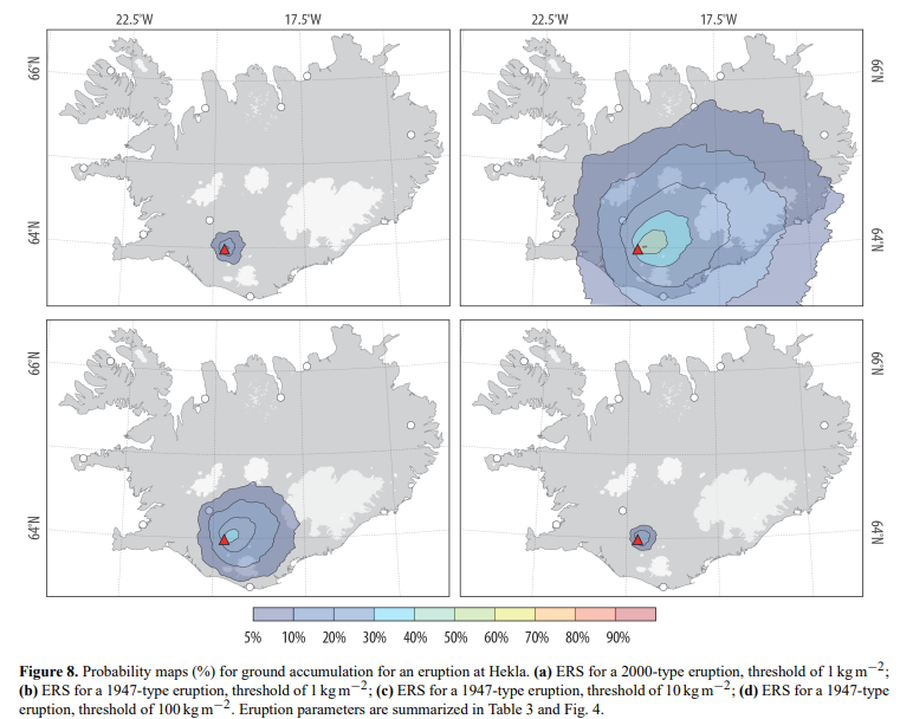
Figure in a journal article
Probability maps (%) for ground accumulation for an eruption at Hekla
Figure 8 in: Biass, S., Scaini, C., Bonadonna, C., Folch, A., Smith, K., & Höskuldsson, A. (2014). A multi-scale risk assessment for tephra fallout and airborne concentration from multiple Icelandic volcanoes–Part 1: Hazard assessment. Natural hazards and earth system sciences, 14(8), 2265-2287. https://doi.org/10.5194/nhess-14-2265-2014