
Advanced Search for Maps
Showing 51-60 of 251
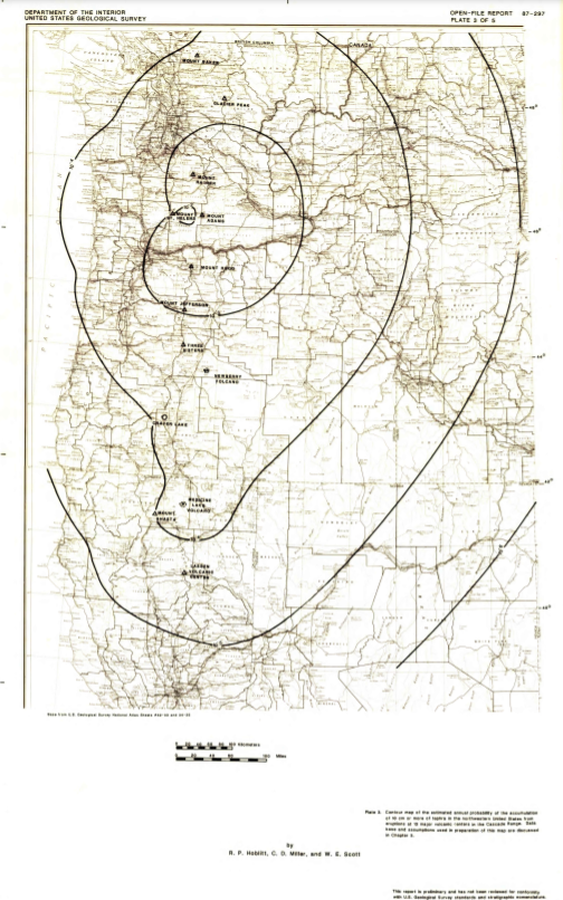
Official, Insert/poster-size map with accompanying report
Contour map of the estimated annual probability of the accumulation of 10 cm or more of tephra in the northwestern United States at eruptions at 13 major volcanic centers in the Cascades Range
Plate 3 in: Hoblitt, R. P., Miller, C. D., & Scott, W. E. (1987). Volcanic hazards with regard to siting nuclear-power plants in the Pacific Northwest. U.S. Geological Survey, Open-File Report 87-297. https://doi.org/10.3133/ofr87297

Figure in a journal article
Early simulations carried out before the onset of the effusive eruption
Figure 4 in: Tarquini, S., de'Michieli Vitturi, M., Jensen, E. H., Pedersen, G. B., Barsotti, S., Coppola, D., & Pfeffer, M. A. (2018). Modeling lava flow propagation over a flat landscape by using MrLavaLoba: the case of the 2014–2015 eruption at Holuhraun, Iceland. Annals of Geophysics. https://doi.org/10.4401/ag-7812
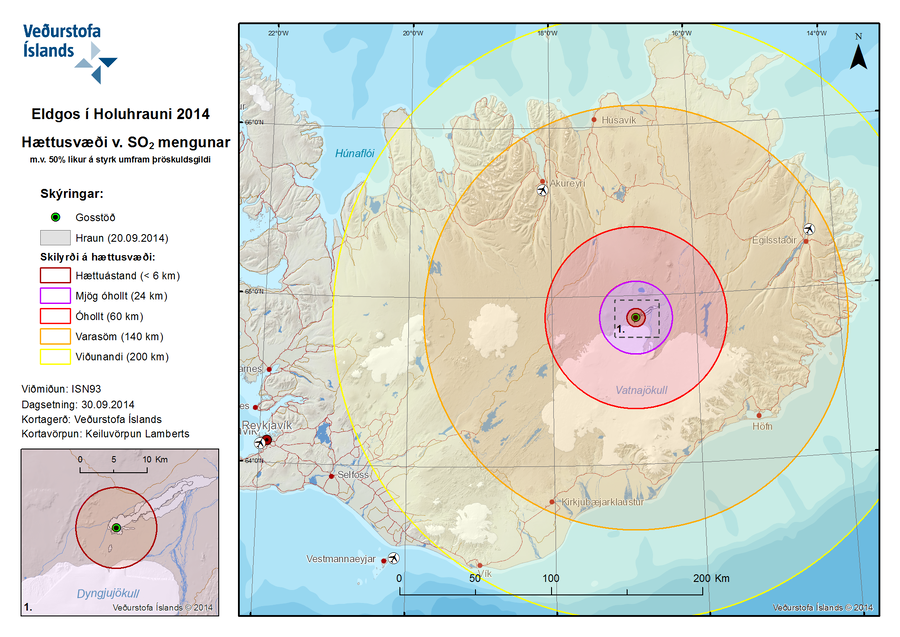
Official, Figure on website
Eldgos í Holuhrauni 2014 Hættusvæði v. SO2 Mengunar m.v. 50% líkur á styrk umfram þröskuldsgildi
(Volcanic Eruption at Holuhraun 2014 Hazardous Area SO2 pollution 50% likelihood of concentration exceeding a threshold value)
Iceland Meteorological Office (IMO). (2014). Eldgos í Holuhrauni 2014 Hættusvæði v. SO2 Mengunar [Volcanic Eruption at Holuhraun 2014 Hazardous Area SO2 pollution]. (Reprinted in: Barsotti, S. (2015). Hazard Zoning: Probabilistic hazard maps of SO2 ground concentration for Holuhraun eruption. https://en.vedur.is/pollution-and-radiation/volcanic-gas/hazard-zoning/)

Official, Figure on website
Eldgos í Holuhrauni 2014 Hættusvæði v. SO2 Mengunar m.v. 90% líkur á styrk umfram þröskuldsgildi
(Volcanic Eruption at Holuhraun 2014 Hazardous Area SO2 pollution 90% likelihood of concentration exceeding a threshold value)
Iceland Meteorological Office (IMO). (2014). Eldgos í Holuhrauni 2014 Hættusvæði v. SO2 Mengunar [Volcanic Eruption at Holuhraun 2014 Hazardous Area SO2 pollution]. (Reprinted in: Barsotti, S. (2015). Hazard Zoning: Probabilistic hazard maps of SO2 ground concentration for Holuhraun eruption. https://en.vedur.is/pollution-and-radiation/volcanic-gas/hazard-zoning/)
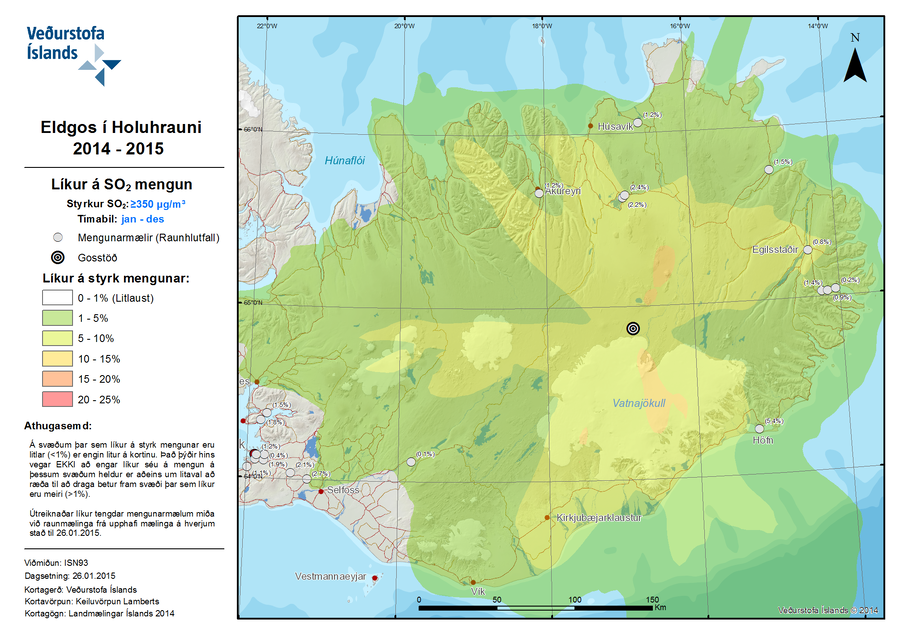
Official, Figure on website
Eldgos í Holuhrauni 2014-2015 Líkur á SO2 Mengun
(Volcanic Eruption at Holuhraun 2014-2015 Probability of SO2 Contamination)
Iceland Meteorological Office (IMO). (2015). Eldgos í Holuhrauni 2014-2015 Líkur á SO2 Mengun [Volcanic Eruption at Holuhraun 2014-2015 Probability of SO2 Contamination]. (Reprinted in: Barsotti, S. (2015). Hazard Zoning: Probabilistic hazard maps of SO2 ground concentration for Holuhraun eruption. https://en.vedur.is/pollution-and-radiation/volcanic-gas/hazard-zoning/)
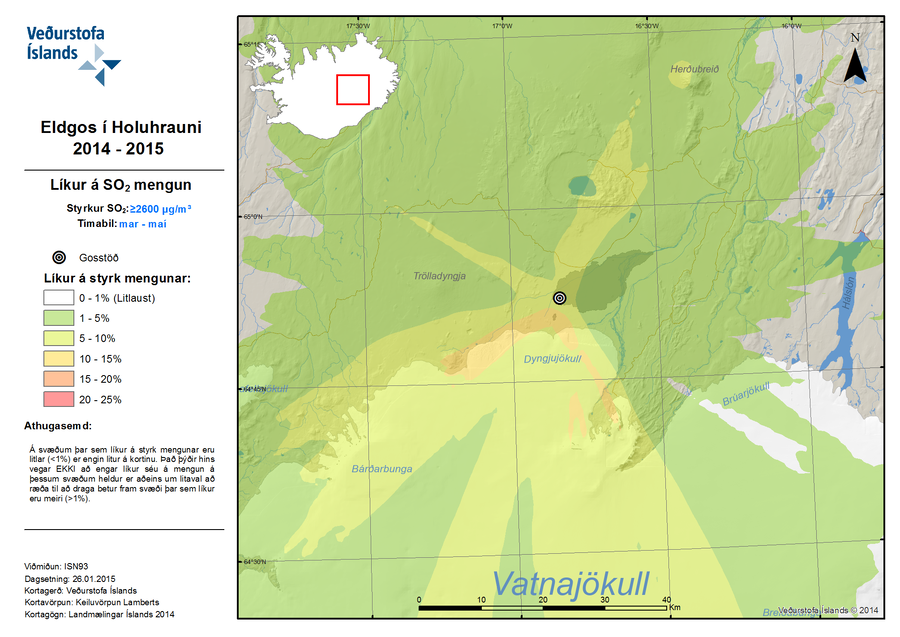
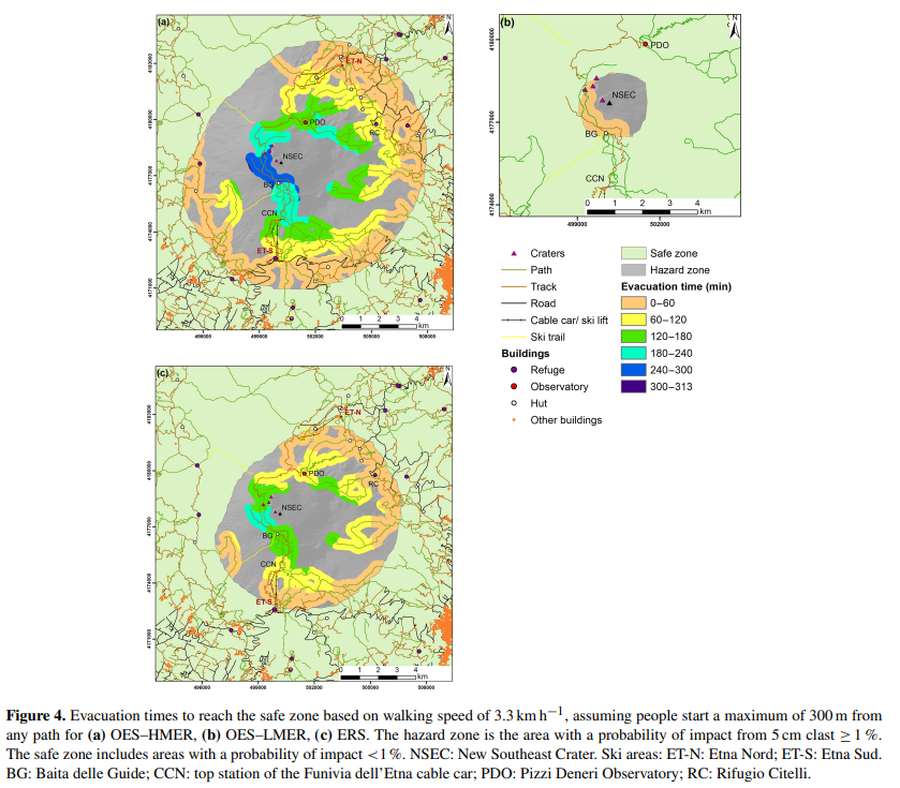
Figure in a journal article
Evacuation times to reach the safe zone based on walking speed of 3.3 km h^−1
Figure 4 in: Osman, S., Rossi, E., Bonadonna, C., Frischknecht, C., Andronico, D., Cioni, R., & Scollo, S. (2019). Exposure-based risk assessment and emergency management associated with the fallout of large clasts at Mount Etna. Natural Hazards and Earth System Sciences, 19(3), 589-610. https://doi.org/10.5194/nhess-19-589-2019
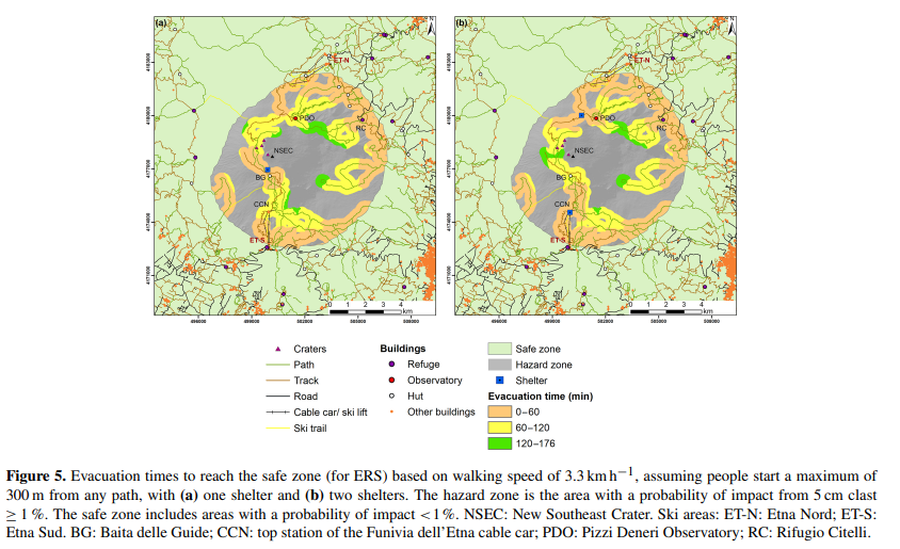
Figure in a journal article
Evacuation times to reach the safe zone based on walking speed of 3.3 km h^−1, assuming people start a maximum of 300 m from any path, with (a) one shelter and (b) two shelters
Figure 5 in: Osman, S., Rossi, E., Bonadonna, C., Frischknecht, C., Andronico, D., Cioni, R., & Scollo, S. (2019). Exposure-based risk assessment and emergency management associated with the fallout of large clasts at Mount Etna. Natural Hazards and Earth System Sciences, 19(3), 589-610. https://doi.org/10.5194/nhess-19-589-2019
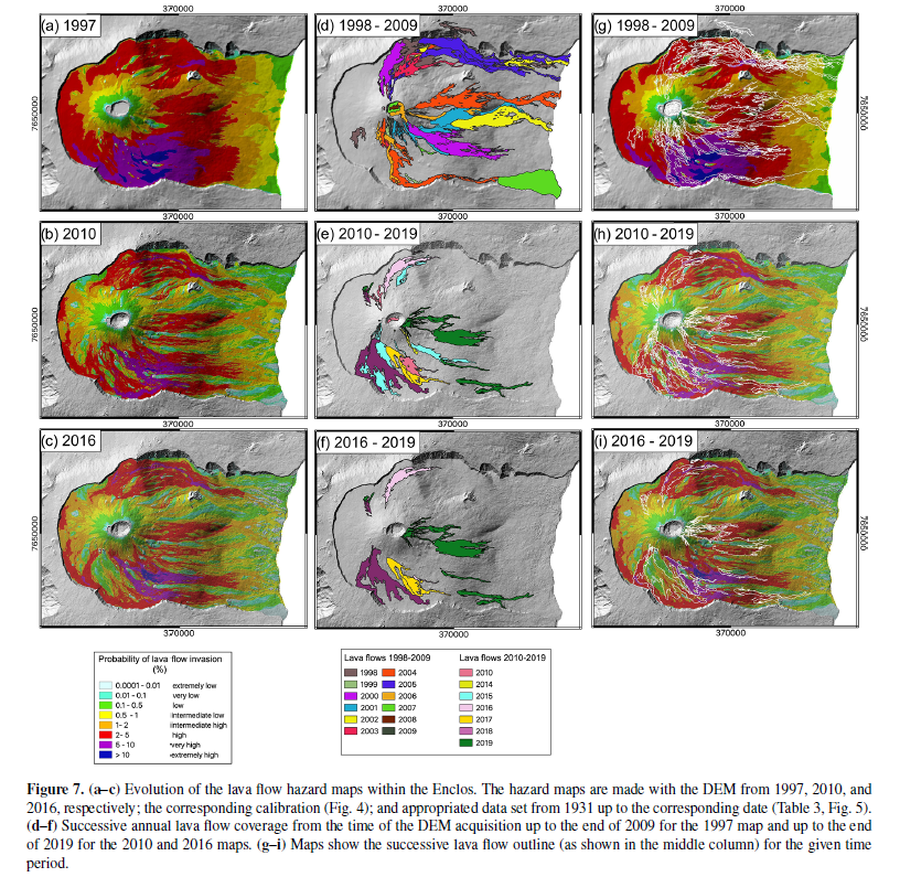
Figure in a journal article
Evolution of the lava flow hazard maps within the Enclos
Figure 7 in: Chevrel, M. O., Favalli, M., Villeneuve, N., Harris, A. J., Fornaciai, A., Richter, N., Derrien, A., Di Muro, A., & Peltier, A. (2021). Lava flow hazard map of Piton de la Fournaise volcano. Natural Hazards and Earth System Sciences, 21(8), 2355-2377. https://doi.org/10.5194/nhess-21-2355-2021, 2021
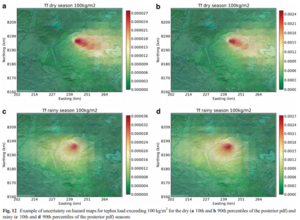
Figure in a journal article
Example of uncertainty on hazard maps for tephra load exceeding 100 kg/m² for the dry (10th and 90th percentiles of the posterior pdf) and rainy (10th and 90th percentiles of the posterior pdf) seasons
Figure 12 in: Sandri, L., Thouret, J. C., Constantinescu, R., Biass, S., & Tonini, R. (2014). Long-term multi-hazard assessment for El Misti volcano (Peru). Bulletin of volcanology, 76(2), 771. https://doi.org/10.1007/s00445-013-0771-9