← Back to Search Results

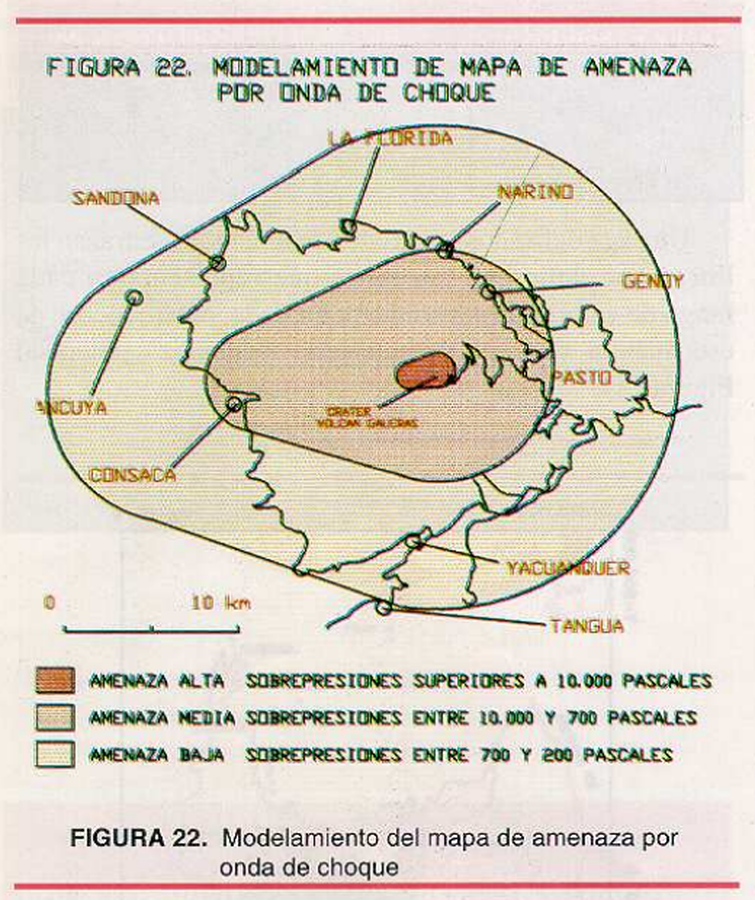
Modelamiento del mapa de amenaza por onda de choque

Modeling of the shock wave hazard map

Galeras, Colombia, 1997

Figure 22 in: Instituto Colombiano de Geología y Minería (INGEOMINAS). (1997). Mapa de Amenaza Volcánica del Galeras. Tercera versión. Publicación Especial de INGEOMINAS.


This map was produced by an official agency, but is NOT the most recent, most complete, or main operational map. For the current operational hazard map, please consult the proper institutional authorities.


Click on image for full-size map. If link seems broken, try the archived version.

Map Set

Instituto Colombiano de Geología y Minería (INGEOMINAS). (1997). Mapa de Amenaza Volcánica del Galeras. Tercera versión. Publicación Especial de INGEOMINAS.
http://recordcenter.sgc.gov.co/B1/11002010020285/documento/pdf/0101202851101000.pdf

Other Maps In Set:

Map Data

Map ID3851
Hazard Process(es)Shockwaves
Hazard Zone PresentationSingle hazard: A single hazard process is represented on a main map panel
Temporal ScaleBackground, or long-term, map
Spatial ScaleVolcano and surrounding area
Publication FormatFigure in a hazard assessment or mitigation plan
Zonation Method(s)Scenario modeling
Zonation Model(s)Prandl-Meyer shockwave model (White 1985)
Scenario(s) ConsideredSpecific past eruption
Hazard Zone Label(s)Estimated value or Hazard Impact Metric
Probability Definition(s)Qualitative relative probability (e.g. high-medium-low)
PurposeLand-use planning: Intended to inform citing of facilities, building restrictions, resource management, and infrastructure development
AudienceMultiple audiences (usually the public, civil authorities, and land-use planners)
Language(s)Spanish
Basemap(s)Street map
Basemap overlay(s)
DiemsionalityPlanimetric (2D or map) view
Color SchemeRed to Yellow
Go to Global Volcanism Program page for Galeras →