
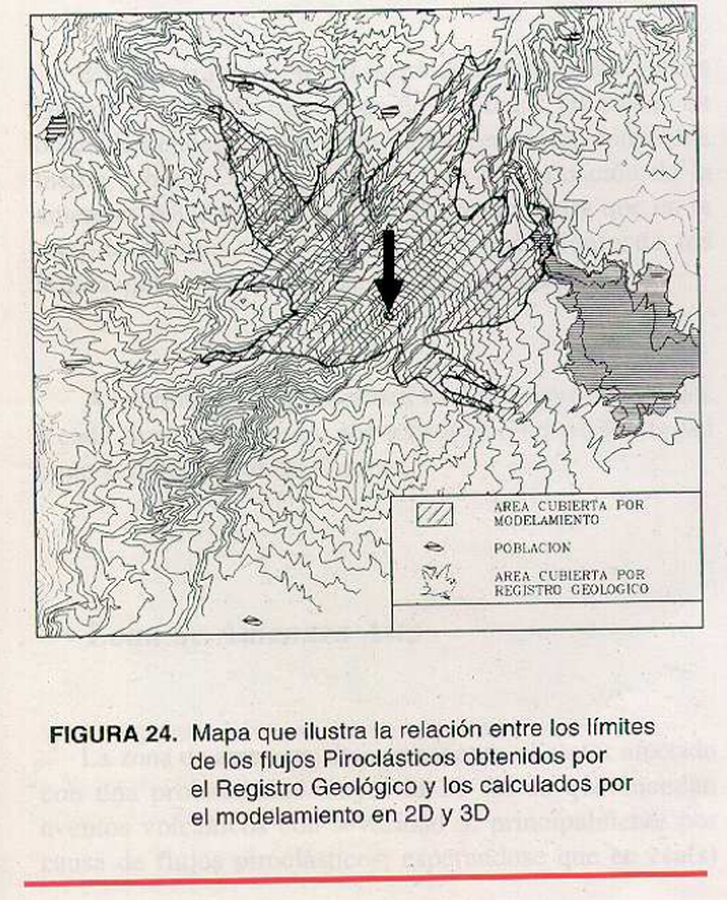
Mapa que ilustra la relación entre los límites de los flujos Piroclásticos obtenidos por el modelamiento en 2D y 3D
Map illustrating the relationship between Pyroclastic flow boundaries obtained by 2D and 3D modeling
Galeras, Colombia, 1997
Figure 24 in: Instituto Colombiano de Geología y Minería (INGEOMINAS). (1997). Mapa de Amenaza Volcánica del Galeras. Tercera versión. Publicación Especial de INGEOMINAS.
This map was produced by an official agency, but is NOT the most recent, most complete, or main operational map.
For the current operational hazard map, please consult the proper institutional authorities.
Click on image for full-size map. If link seems broken, try the archived version.
Instituto Colombiano de Geología y Minería (INGEOMINAS). (1997). Mapa de Amenaza Volcánica del Galeras. Tercera versión. Publicación Especial de INGEOMINAS.Map Set
http://recordcenter.sgc.gov.co/B1/11002010020285/documento/pdf/0101202851101000.pdf
Other Maps In Set: