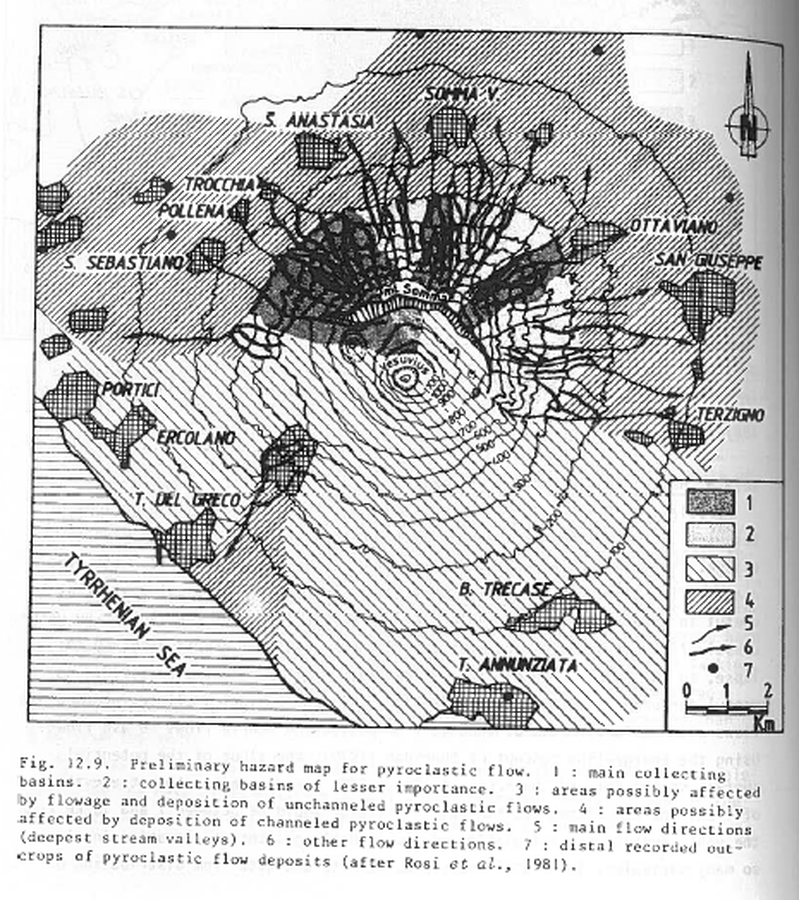
Preliminary hazard map for pyroclastic flows
Vesuvius, Italy, 1983
Figure 12.9 in: Barberi, F., Rosi, M., Santacroce, R., & Sheridan, M.F. (1983). Volcanic hazard zonation: Mt. Vesuvius. In: Tazieff, H. & Sabroux, J.-C. (Eds.) Forecasting Volcanic Events, Elsevier, Amsterdam, p. 149-161.
This hazard map is the result of scientific research and was published in academic literature.
It is presented here to serve as an example of the map type or the map-making methodology. It is NOT the official, operational map. For the current operational hazard map, please consult the proper institutional authorities.

Map Set
Map Data
Map ID 656 Hazard Process(es) PDCs Hazard Zone Presentation Single hazard: A single hazard process is represented on a main map panel Temporal Scale Background, or long-term, map Spatial Scale Volcano and surrounding area Publication Format Figure in a journal article Zonation Method(s) Scenario modeling Zonation Model(s) Energy cone or line (Heim 1932; Sheridan 1979; Sheridan & Malin 1983) Scenario(s) Considered Style or type Hazard Zone Label(s) Qualitative relative probability (e.g. high-medium-low) Probability Definition(s) Qualitative relative probability (e.g. high-medium-low) Purpose Scientific interest: Intended for scientific research and general scientific interest; usually published in academic journals Audience Scientists (usually in scientific publication) Language(s) English Basemap(s) Contour lines Basemap overlay(s) Inhabited areas Diemsionality Planimetric (2D or map) view Color Scheme Symbols and/or lines only