
Advanced Search for Maps
Showing 1-10 of 22
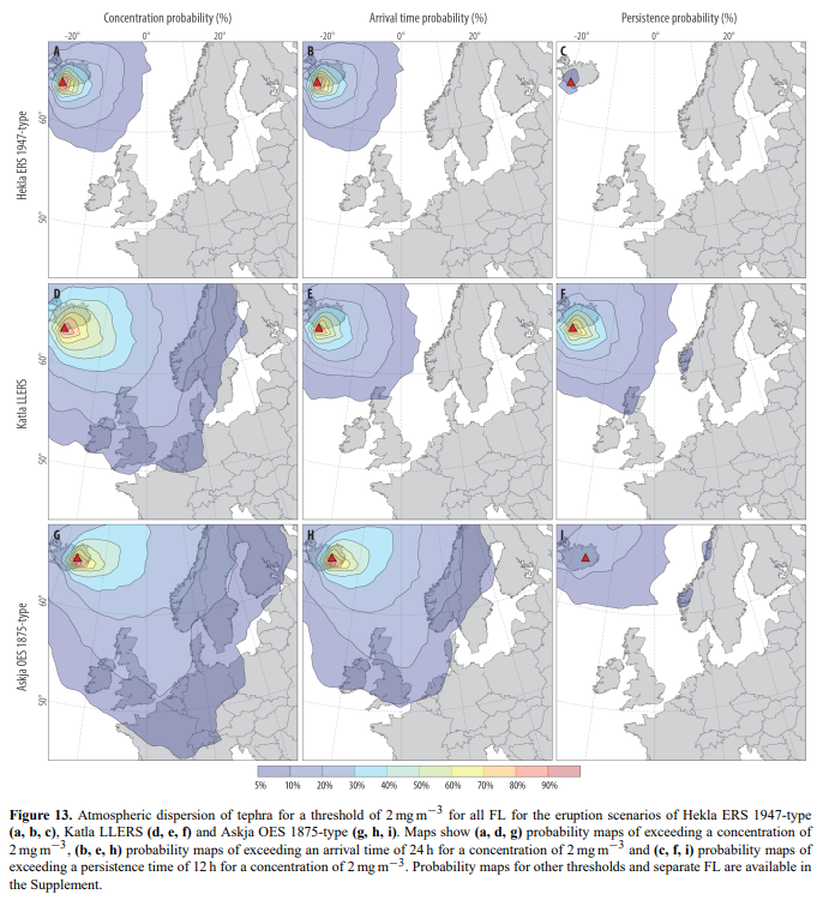
Figure in a journal article
Atmospheric dispersion of tephra for a threshold of 2 mg m−3 for all FL for the eruption scenarios of Hekla ERS 1947-type (a, b, c), Katla LLERS (d, e, f) and Askja OES 1875-type (g, h, i)
Figure 13 in: Biass, S., Scaini, C., Bonadonna, C., Folch, A., Smith, K., & Höskuldsson, A. (2014). A multi-scale risk assessment for tephra fallout and airborne concentration from multiple Icelandic volcanoes–Part 1: Hazard assessment. Natural hazards and earth system sciences, 14(8), 2265-2287. https://doi.org/10.5194/nhess-14-2265-2014
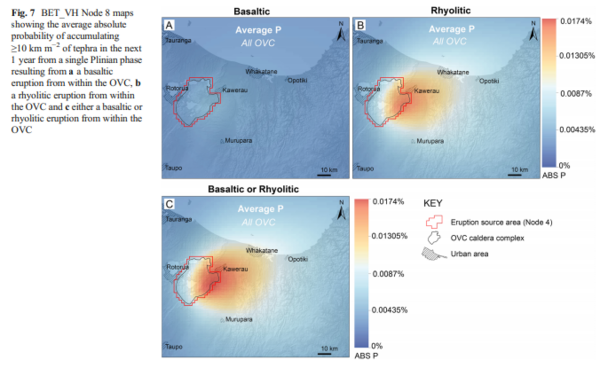
Figure in a journal article
BET_VH Node 8 maps showing the average absolute probability of accumulating ≥10 km m−2 of tephra in the next 1 year from a single Plinian phase resulting from a a basaltic eruption from within the OVC, b a rhyolitic eruption from within the OVC and c either a basaltic or rhyolitic eruption from within the OVC
Figure 7 in: Thompson, M. A., Lindsay, J. M., Sandri, L., Biass, S., Bonadonna, C., Jolly, G., & Marzocchi, W. (2015). Exploring the influence of vent location and eruption style on tephra fall hazard from the Okataina Volcanic Centre, New Zealand. Bulletin of volcanology, 77(5), 38. https://doi.org/10.1007/s00445-015-0926-y
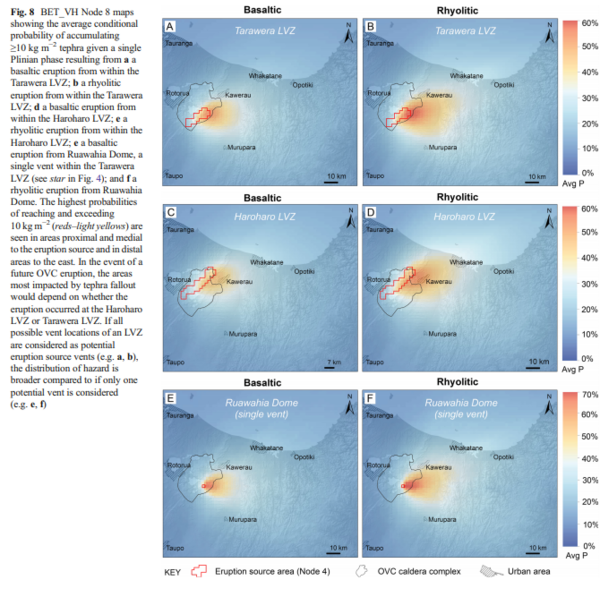
Figure in a journal article
BET_VH Node 8 maps showing the average conditional probability of accumulating ≥10 kg m−2 tephra given a single Plinian phase resulting from a a basaltic eruption from within the Tarawera LVZ; b a rhyolitic eruption from within the Tarawera LVZ; d a basaltic eruption from within the Haroharo LVZ; e a rhyolitic eruption from within the Haroharo LVZ; e a basaltic eruption from Ruawahia Dome, a single vent within the Tarawera LVZ (see star in Fig. 4); and f a rhyolitic eruption from Ruawahia Dome
Figure 8 in: Thompson, M. A., Lindsay, J. M., Sandri, L., Biass, S., Bonadonna, C., Jolly, G., & Marzocchi, W. (2015). Exploring the influence of vent location and eruption style on tephra fall hazard from the Okataina Volcanic Centre, New Zealand. Bulletin of volcanology, 77(5), 38. https://doi.org/10.1007/s00445-015-0926-y
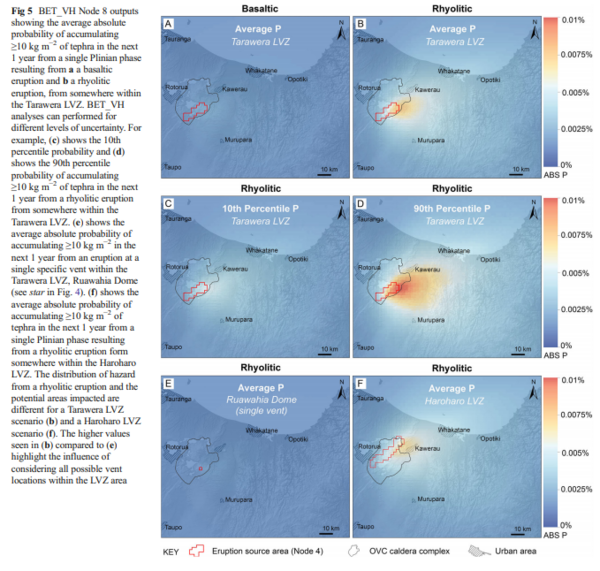
Figure in a journal article
BET_VH Node 8 outputs showing the average absolute probability of accumulating ≥10 kg m−2 of tephra in the next 1 year from a single Plinian phase resulting from a a basaltic eruption and b a rhyolitic eruption, from somewhere within the Tarawera LVZ
Figure 5 in: Thompson, M. A., Lindsay, J. M., Sandri, L., Biass, S., Bonadonna, C., Jolly, G., & Marzocchi, W. (2015). Exploring the influence of vent location and eruption style on tephra fall hazard from the Okataina Volcanic Centre, New Zealand. Bulletin of volcanology, 77(5), 38. https://doi.org/10.1007/s00445-015-0926-y
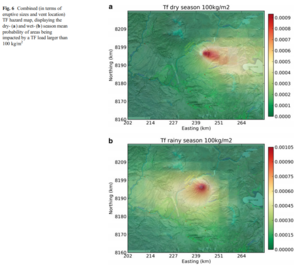
Figure in a journal article
Combined (in terms of eruptive sizes and vent location) TF hazard map, displaying the dry- and wet-season mean probability of areas being impacted by a TF load larger than 100 kg/m²
Figure 6 in: Sandri, L., Thouret, J. C., Constantinescu, R., Biass, S., & Tonini, R. (2014). Long-term multi-hazard assessment for El Misti volcano (Peru). Bulletin of volcanology, 76(2), 771. https://doi.org/10.1007/s00445-013-0771-9
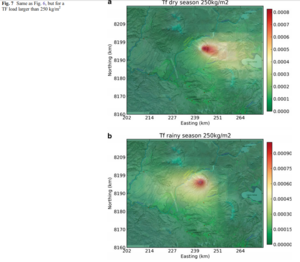
Figure in a journal article
Combined (in terms of eruptive sizes and vent location) TF hazard map, displaying the dry- and wet-season mean probability of areas being impacted by a TF load larger than 250 kg/m²
Figure 7 in: Sandri, L., Thouret, J. C., Constantinescu, R., Biass, S., & Tonini, R. (2014). Long-term multi-hazard assessment for El Misti volcano (Peru). Bulletin of volcanology, 76(2), 771. https://doi.org/10.1007/s00445-013-0771-9
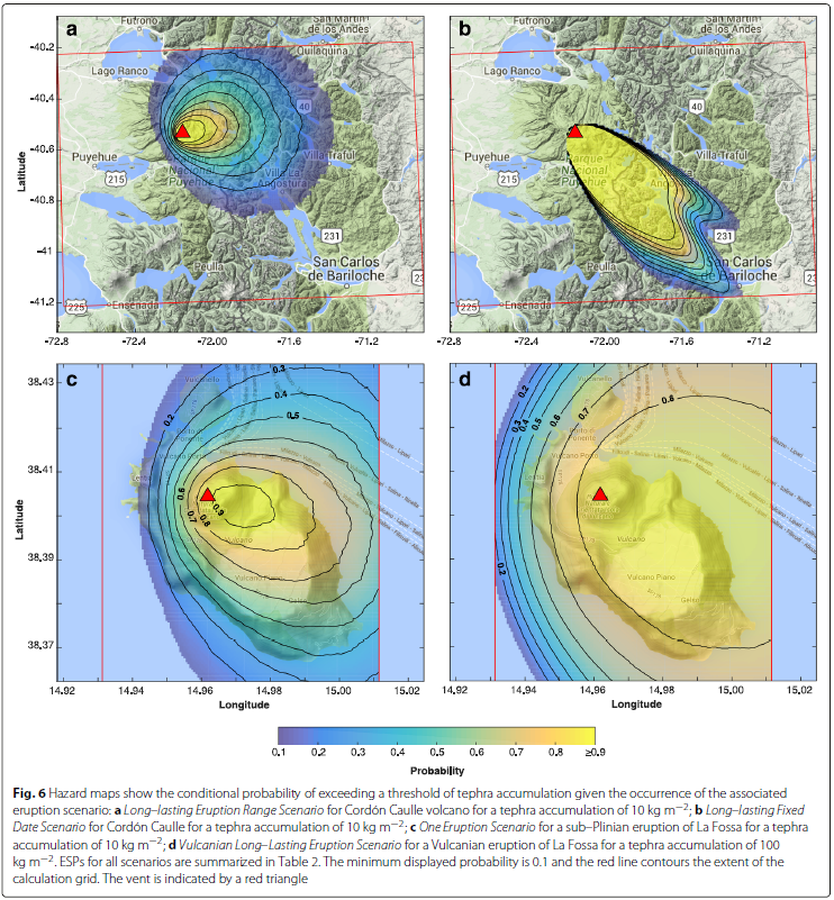
Figure in a journal article
Hazard maps show the conditional probability of exceeding a threshold of tephra accumulation given the occurrence of the associated eruption scenario
Figure 6 in: Biass, S., Bonadonna, C., Connor, L., & Connor, C. (2016). TephraProb: a Matlab package for probabilistic hazard assessments of tephra fallout. Journal of Applied Volcanology, 5(1), 1-16. https://doi.org/10.1186/s13617-016-0050-5
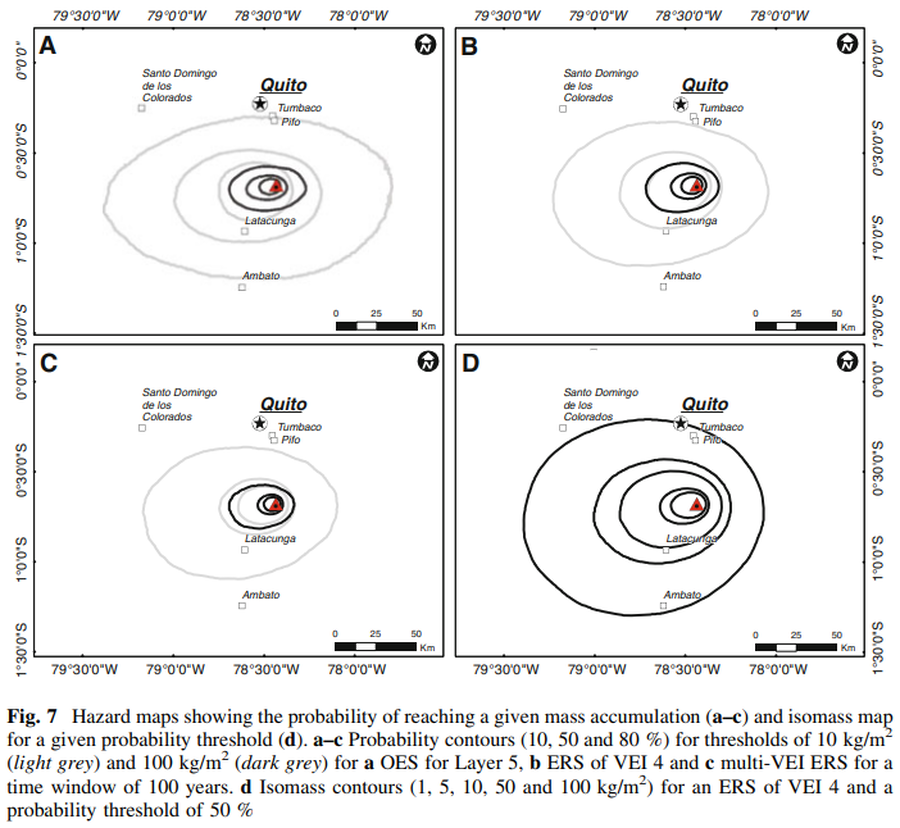
Figure in a journal article
Hazard maps showing the probability of reaching a given mass accumulation (a–c) and isomass map for a given probability threshold (d)
Figure 7 in: Biass, S., & Bonadonna, C. (2013). A fast GIS-based risk assessment for tephra fallout: the example of Cotopaxi volcano, Ecuador. Natural Hazards, 65, 477-495. https://doi.org/10.1007/s11069-012-0378-z
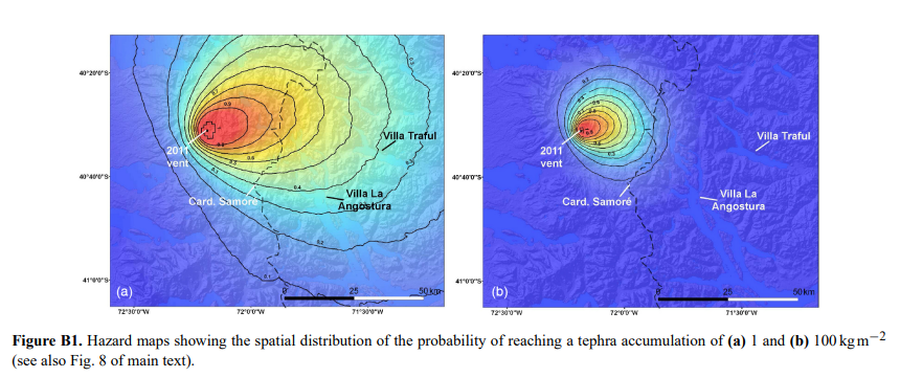
Figure in a journal article
Hazard maps showing the spatial distribution of the probability of reaching a tephra accumulation of (a) 1 and (b) 100 kg m−2
Figure B1 in: Elissondo, M., Baumann, V., Bonadonna, C., Pistolesi, M., Cioni, R., Bertagnini, A., Biass, S., Herrero, J.-C., & Gonzalez, R. (2016). Chronology and impact of the 2011 Cordón Caulle eruption, Chile. Natural Hazards and Earth System Sciences, 16(3), 675-704. https://doi.org/10.5194/nhess-16-675-2016, 2016
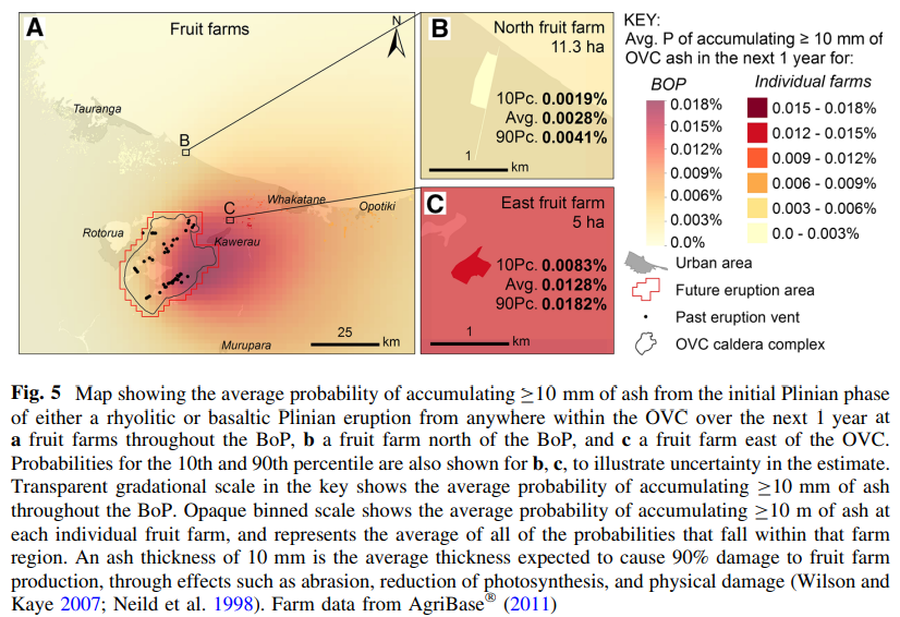
Figure in a journal article
Map showing the average probability of accumulating C10 mm of ash from the initial Plinian phase of either a rhyolitic or basaltic Plinian eruption from anywhere within the OVC over the next 1 year
Figure 5 in: Thompson, M. A., Lindsay, J. M., Wilson, T. M., Biass, S., & Sandri, L. (2017). Quantifying risk to agriculture from volcanic ashfall: a case study from the Bay of Plenty, New Zealand. Natural Hazards, 86(1), 31-56. https://doi.org/10.1007/s11069-016-2672-7