
Advanced Search for Maps
Showing 61-70 of 252
Official, Figure in a journal article
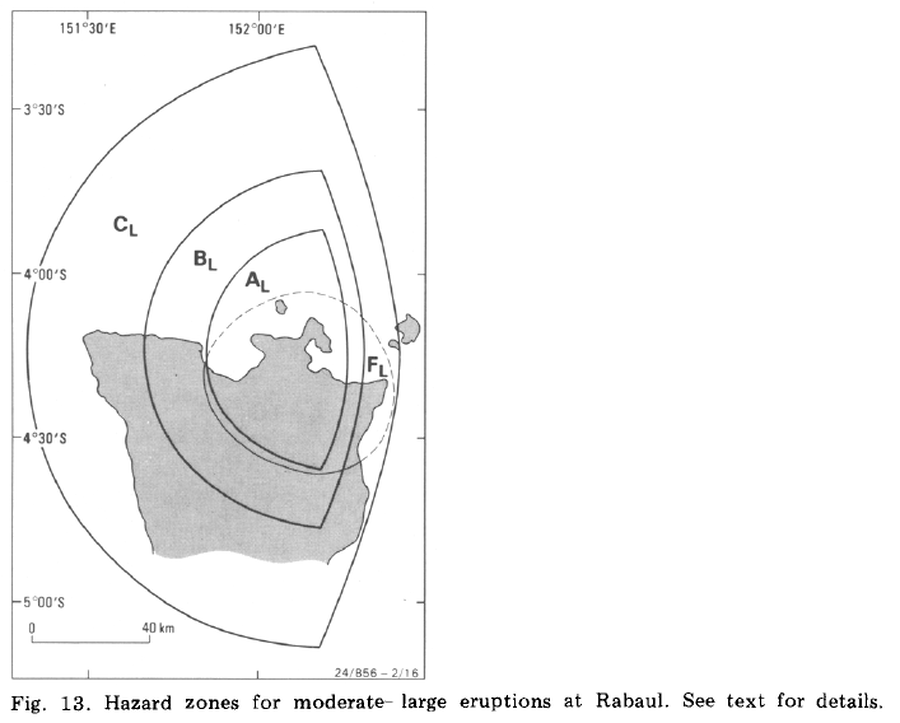
Hazard zones for moderate-large eruptions at Rabaul
Figure 13 in: McKee, C. O., Johnson, R. W., Lowenstein, P. L., Riley, S. J., Blong, R. J., De Saint Ours, P., & Talai, B. (1985). Rabaul caldera, Papua New Guinea: volcanic hazards, surveillance, and eruption contingency planning. Journal of Volcanology and Geothermal Research, 23(3-4), p. 195-237. https://doi.org/10.1016/0377-0273(85)90035-6
Official, Figure in a journal article
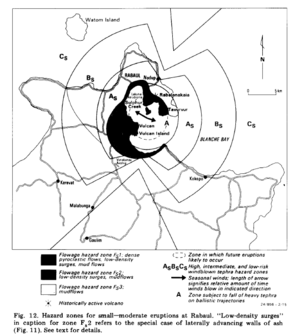
Hazard zones for small--moderate eruptions at Rabaul
Figure 12 in: McKee, C. O., Johnson, R. W., Lowenstein, P. L., Riley, S. J., Blong, R. J., De Saint Ours, P., & Talai, B. (1985). Rabaul caldera, Papua New Guinea: volcanic hazards, surveillance, and eruption contingency planning. Journal of Volcanology and Geothermal Research, 23(3-4), p. 195-237. https://doi.org/10.1016/0377-0273(85)90035-6
Official, Figure in hazard assessment
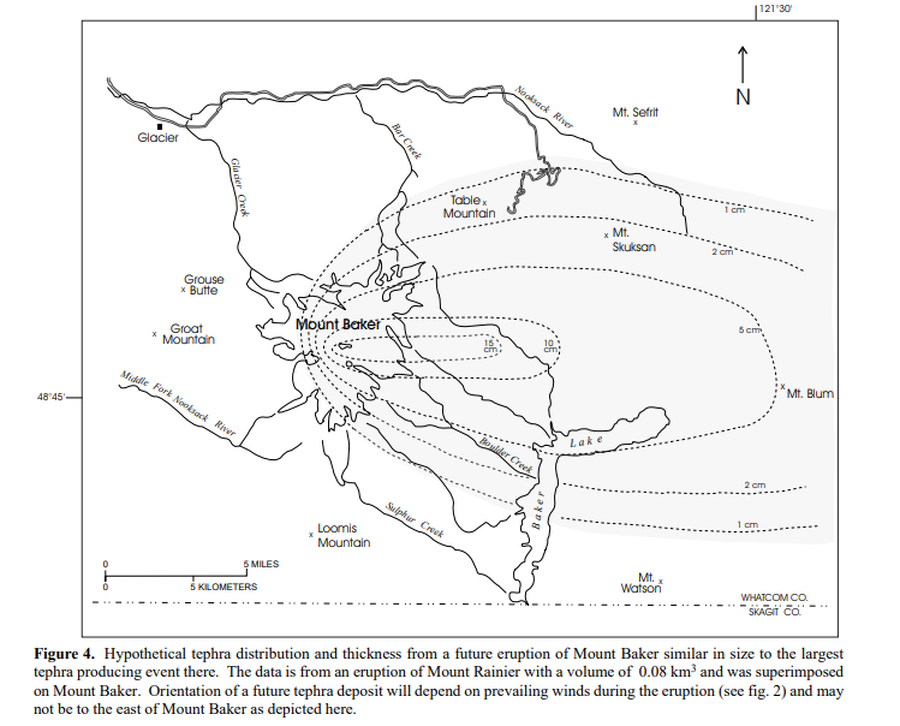
Hypothetical tephra distribution and thickness from a future eruptions of Mount Baker similar in size to the largest tephra producing event there
Figure 4 in: Gardner, C.A., Scott, K.M., Miller, C.D., Myers, B., Hildreth, W., & Pringle, P.T. (1995). Potential volcanic hazards from future activity of Mount Baker, Washington. U.S. Geological Survey, Open-File Report 95-498, 16 p., 1 plate, scale 1:100,000. https://doi.org/10.3133/ofr95498
Official, Figure in a journal article
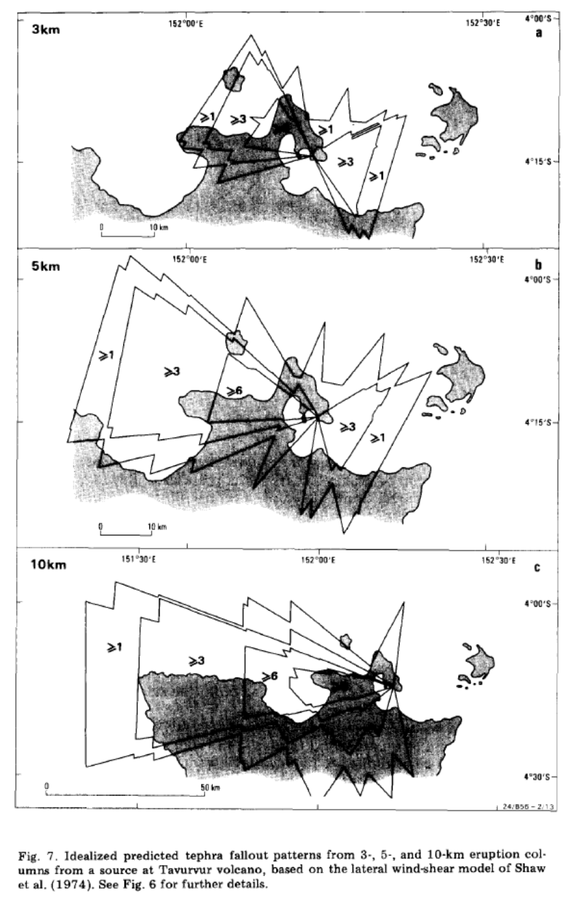
Idealized predicted tephra fallout patterns from 3-, 5-, and 10-km eruption columns from a source at Tavurvur volcano
Figure 7 in: McKee, C. O., Johnson, R. W., Lowenstein, P. L., Riley, S. J., Blong, R. J., De Saint Ours, P., & Talai, B. (1985). Rabaul caldera, Papua New Guinea: volcanic hazards, surveillance, and eruption contingency planning. Journal of Volcanology and Geothermal Research, 23(3-4), p. 195-237. https://doi.org/10.1016/0377-0273(85)90035-6
Official, Figure in a journal article
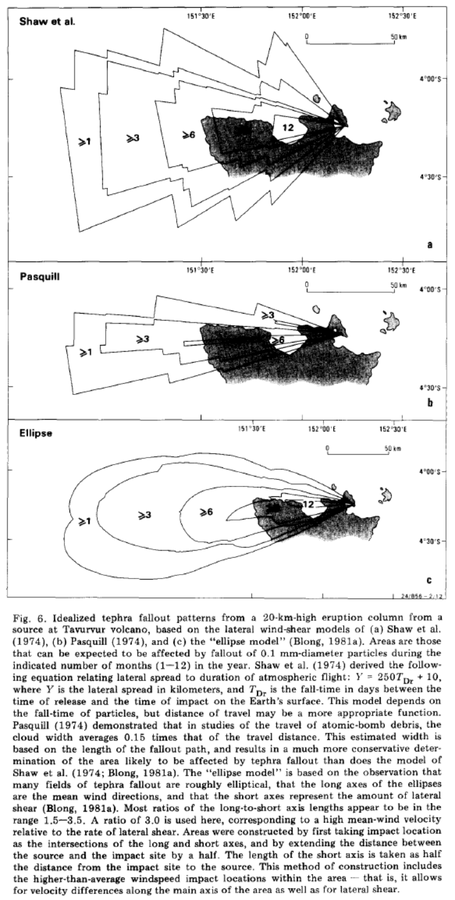
Idealized tephra fallout patterns from a 20-km-high eruption column from a source at Tavurvur volcano
Figure 6 in: McKee, C. O., Johnson, R. W., Lowenstein, P. L., Riley, S. J., Blong, R. J., De Saint Ours, P., & Talai, B. (1985). Rabaul caldera, Papua New Guinea: volcanic hazards, surveillance, and eruption contingency planning. Journal of Volcanology and Geothermal Research, 23(3-4), p. 195-237. https://doi.org/10.1016/0377-0273(85)90035-6
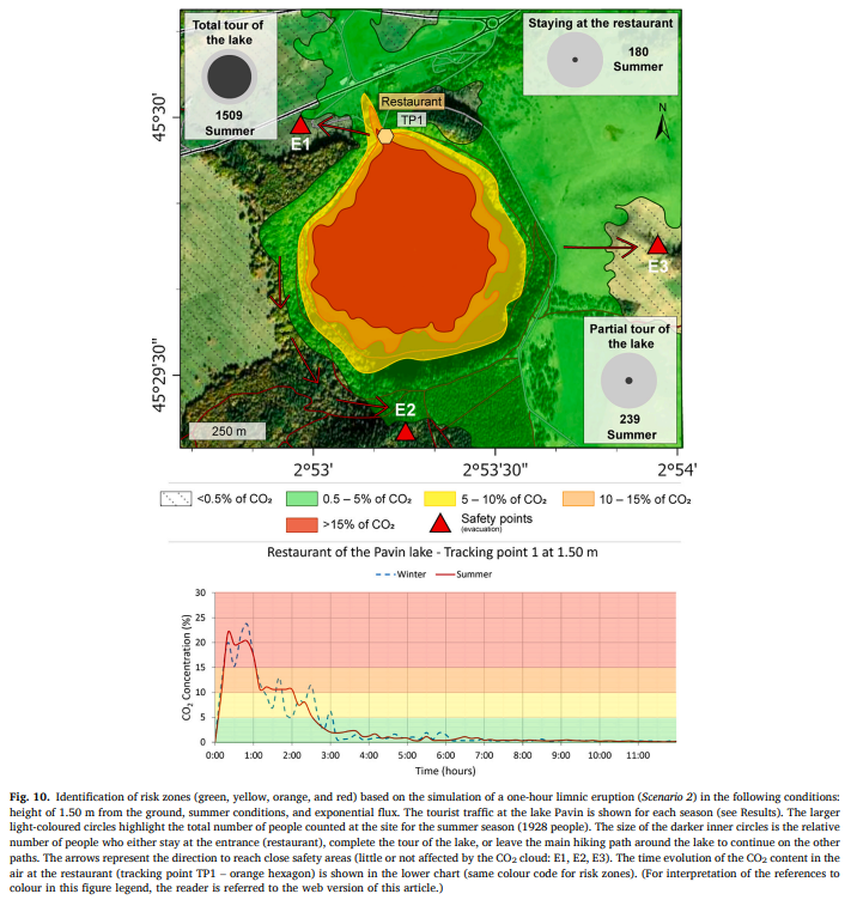
Figure in a journal article
Identification of risk zones (green, yellow, orange, and red) based on the simulation of a one-hour limnic eruption (Scenario 2)
Figure 10 in: Rafflin, V., Boudoire, G., Massaro, S., Stocchi, M., Costa, A., Grassa, F., Giuffrida, G., Gailler, L., Planche, C., Banson, S., & Harris, A. (2024). Modelling CO2 dispersion in the air during potential limnic eruption at the lake Pavin (France). Journal of Volcanology and Geothermal Research, 108024. https://doi.org/10.1016/j.jvolgeores.2024.108024
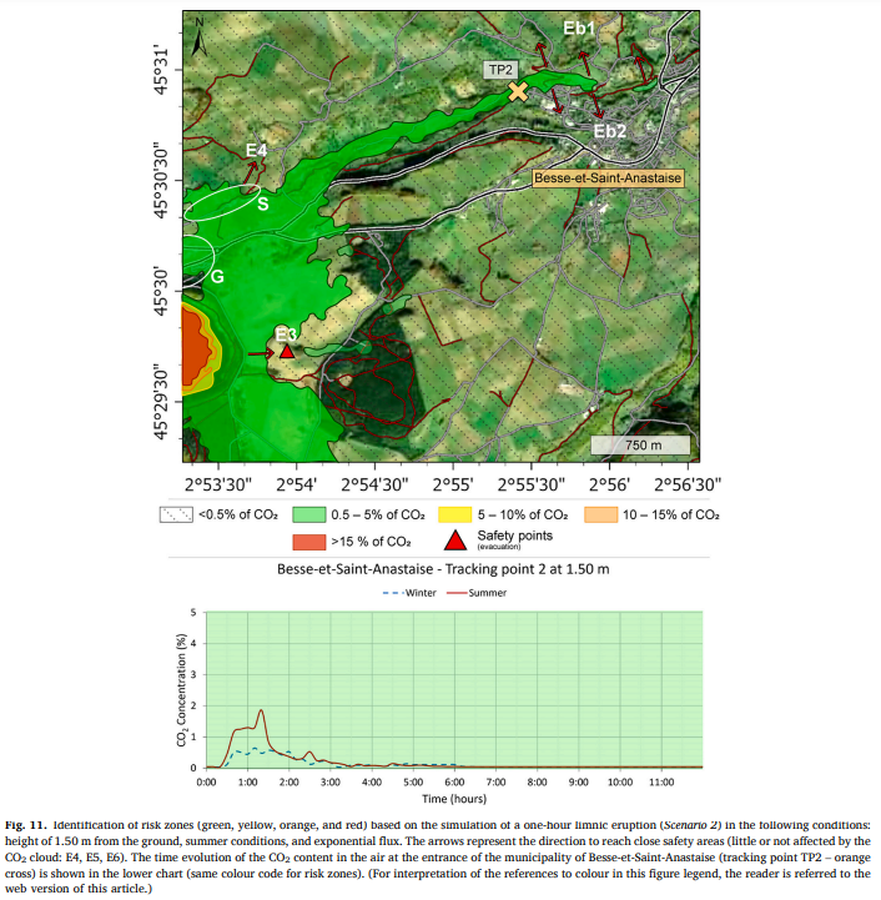
Figure in a journal article
Identification of risk zones (green, yellow, orange, and red) based on the simulation of a one-hour limnic eruption (Scenario 2)
Figure 11 in: Rafflin, V., Boudoire, G., Massaro, S., Stocchi, M., Costa, A., Grassa, F., Giuffrida, G., Gailler, L., Planche, C., Banson, S., & Harris, A. (2024). Modelling CO2 dispersion in the air during potential limnic eruption at the lake Pavin (France). Journal of Volcanology and Geothermal Research, 108024. https://doi.org/10.1016/j.jvolgeores.2024.108024
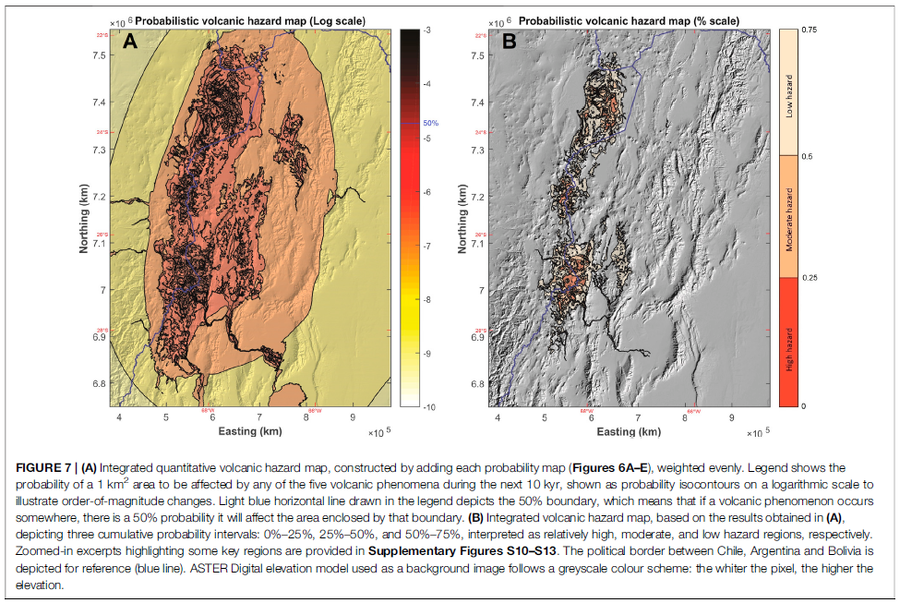
Figure in a journal article
Integrated quantitative volcanic hazard map, constructed by adding each probability map (Figures 6A–E), weighted evenly
Figure 7 in: Bertin, D., Lindsay, J.M., Cronin, S.J., de Silva, S.L., Connor, C.B., Caffe, P.J., Grosse, P., Báez, W., Bustos, E., & Constantinescu, R. (2022). Probabilistic Volcanic Hazard Assessment of the 22.5–28° S Segment of the Central Volcanic Zone of the Andes. Frontiers in Earth Science, 10. https://doi.org/10.3389/feart.2022.875439
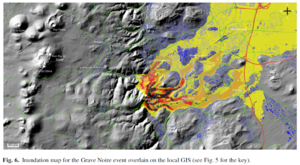
Figure in a journal article
Inundation map for the Grave Noire event overlain on the local GIS
Figure 6 in: Latutrie, B., Andredakis, I., De Groeve, T., Harris, A. J. L., Langlois, E., de Vries, B. V. W., Saubin, E., Bilotta, G., Cappello, A., Crisci, G.M., D'ambrosio, D., Del Negro, C., Favalli, M., Fujita, E., Iovine, G., Kelfoun, K., Rongo, R., Spataro, W., Tarquini, S., Coppola, D., Ganci, G., Marchese, F., Pergola, N., & Tramutoli, V. (2016). Testing a geographical information system for damage and evacuation assessment during an effusive volcanic crisis. In: Harris, A.J.L., De Groeve, T., & Carn, S.A. (Eds.) Detecting, Modelling and Responding to Effusive Eruptions. Geological Society, London, Special Publications, 426(1), p. 649-672. https://doi.org/10.1144/SP426.19
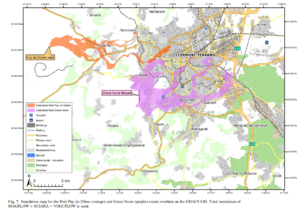
Figure in a journal article
Inundation map for the Petit Puy de Dome (orange) and Grave Noire (purple) events overlain on the GDACS GIS
Figure 7 in: Latutrie, B., Andredakis, I., De Groeve, T., Harris, A. J. L., Langlois, E., de Vries, B. V. W., Saubin, E., Bilotta, G., Cappello, A., Crisci, G.M., D'ambrosio, D., Del Negro, C., Favalli, M., Fujita, E., Iovine, G., Kelfoun, K., Rongo, R., Spataro, W., Tarquini, S., Coppola, D., Ganci, G., Marchese, F., Pergola, N., & Tramutoli, V. (2016). Testing a geographical information system for damage and evacuation assessment during an effusive volcanic crisis. In: Harris, A.J.L., De Groeve, T., & Carn, S.A. (Eds.) Detecting, Modelling and Responding to Effusive Eruptions. Geological Society, London, Special Publications, 426(1), p. 649-672. https://doi.org/10.1144/SP426.19