
Advanced Search for Maps
Showing 211-220 of 2217
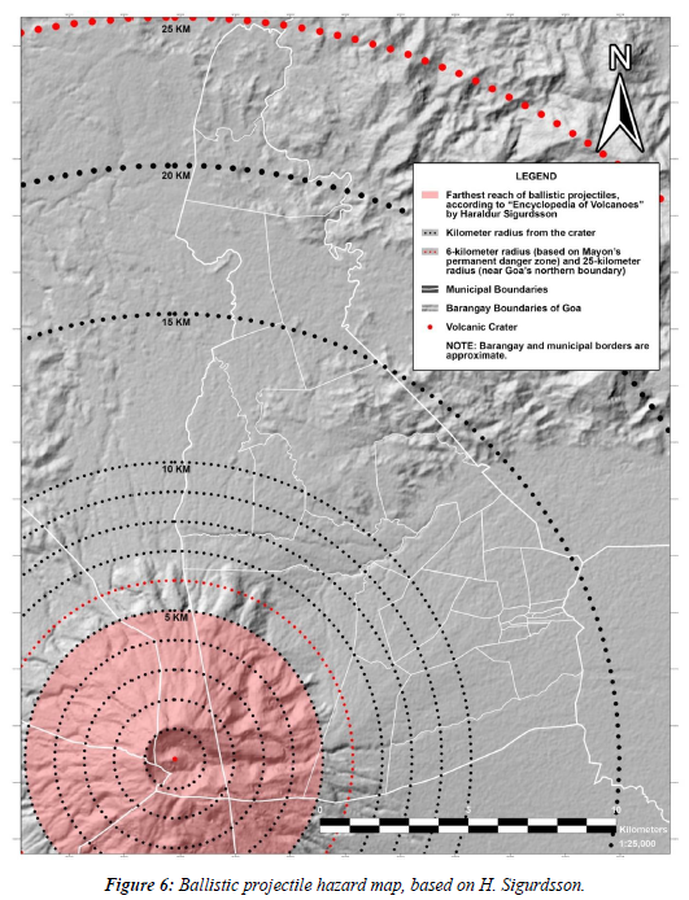
Figure in a thesis or dissertation
Ballistic projectile hazard map
Figure 6 in: Daita, T.J.E. (2020). Preliminary Volcanic Hazard Assessment of Goa, Camarines Sur, Philippines. Thesis, Partido State University, Goa, Camarines Sur, Philippines.
Official, Map sheet or poster
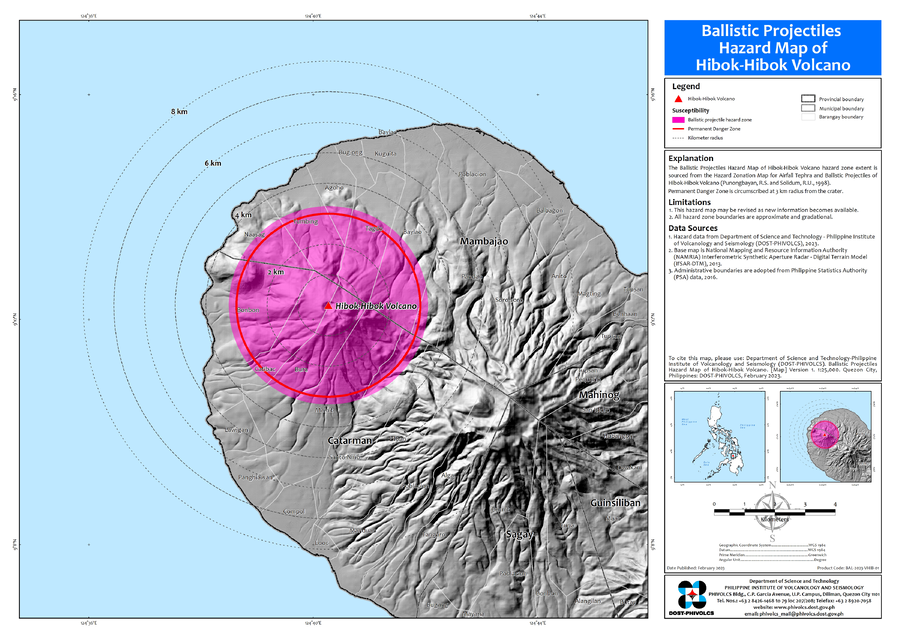
Ballistic Projectiles Hazard Map of Hibok-Hibok Volcano
Department of Science and Technology-Philippine Institute of Volcanology and Seismology (DOST-PHIVOLCS). (2023). Ballistic Projectiles Hazard Map of Hibok-Hibok Volcano. Version 1. 1:25,000. Quezon City, Philippines.
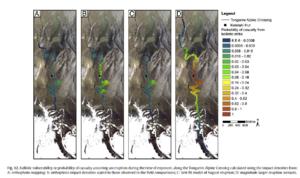
Figure in a journal article
Ballistic vulnerability or probability of casualty assuming an eruption during the time of exposure, along the Tongariro Alpine Crossing
Figure 12 in: Fitzgerald, R. H., Tsunematsu, K., Kennedy, B. M., Breard, E. C. P., Lube, G., Wilson, T. M., Jolly, A.D., Pawson, J., Rosenburg, M.D., & Cronin, S. J. (2014). The application of a calibrated 3D ballistic trajectory model to ballistic hazard assessments at Upper Te Maari, Tongariro. Journal of volcanology and geothermal research, 286, p. 248-262. https://doi.org/10.1016/j.jvolgeores.2014.04.006
Official, Flyer, brochure, short fact-sheet, or handout
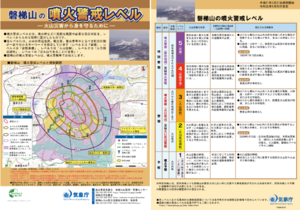
Bandaisan Volcanic Alert Levels
Japan Meteorological Agency. (2019). Bandaisan Volcanic Alert Levels. Volcano Monitoring and Warning Center, Volcano Division, Earthquake and Volcano Department.

Figure in a thesis or dissertation
Batur Community Hazard Map
Figure 5.5 in: Donovan, K.H.M. (2010). Cultural responses to volcanic hazards on Mt Merapi, Indonesia. University of Plymouth, PhD Dissertation.
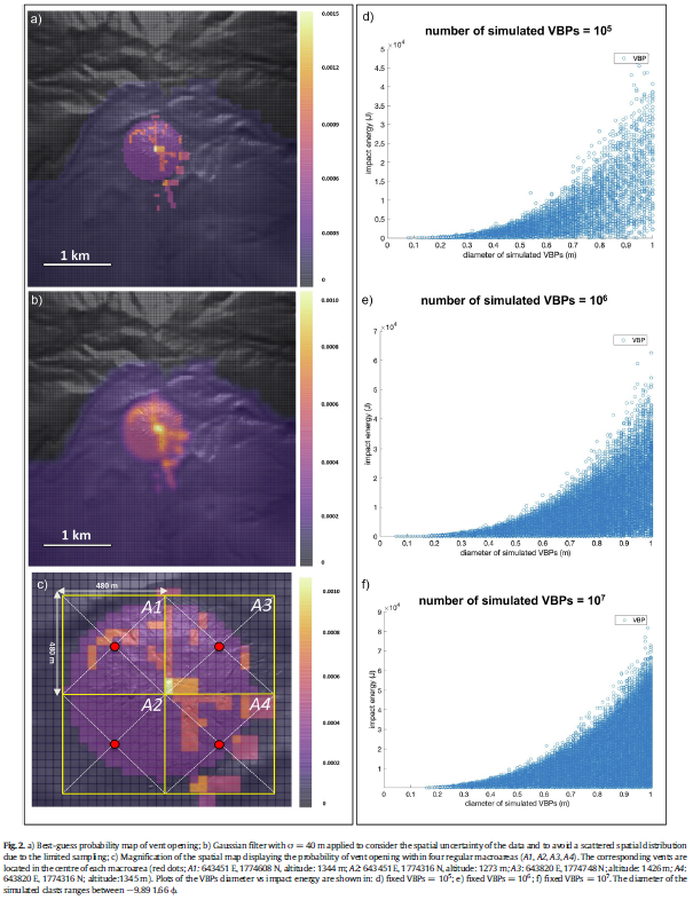
Figure in a journal article
Best-guess probability map of vent opening
Figure 2 in: Massaro, S., Rossi, E., Sandri, L., Bonadonna, C., Selva, J., Moretti, R., & Komorowski, J. C. (2022). Assessing hazard and potential impact associated with volcanic ballistic projectiles: The example of La Soufrière de Guadeloupe volcano (Lesser Antilles). Journal of volcanology and geothermal research, 423, 107453. https://doi.org/10.1016/j.jvolgeores.2021.107453
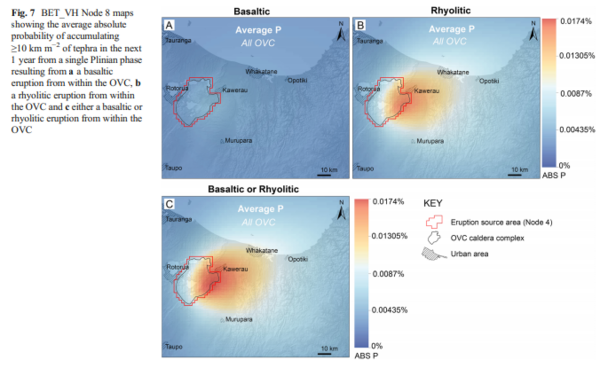
Figure in a journal article
BET_VH Node 8 maps showing the average absolute probability of accumulating ≥10 km m−2 of tephra in the next 1 year from a single Plinian phase resulting from a a basaltic eruption from within the OVC, b a rhyolitic eruption from within the OVC and c either a basaltic or rhyolitic eruption from within the OVC
Figure 7 in: Thompson, M. A., Lindsay, J. M., Sandri, L., Biass, S., Bonadonna, C., Jolly, G., & Marzocchi, W. (2015). Exploring the influence of vent location and eruption style on tephra fall hazard from the Okataina Volcanic Centre, New Zealand. Bulletin of volcanology, 77(5), 38. https://doi.org/10.1007/s00445-015-0926-y
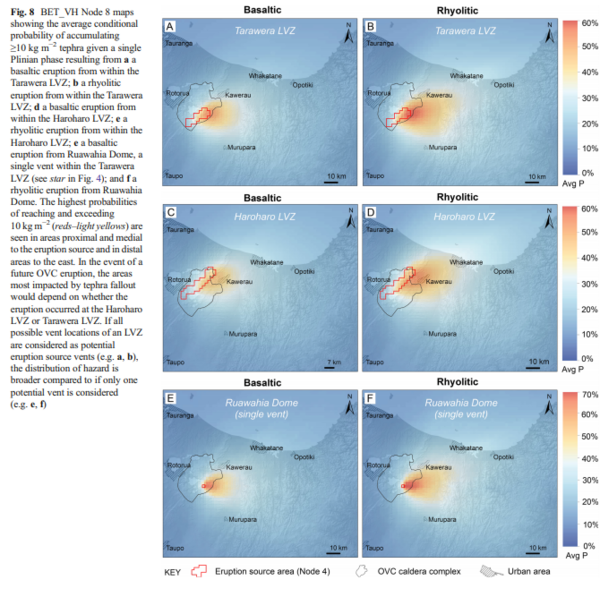
Figure in a journal article
BET_VH Node 8 maps showing the average conditional probability of accumulating ≥10 kg m−2 tephra given a single Plinian phase resulting from a a basaltic eruption from within the Tarawera LVZ; b a rhyolitic eruption from within the Tarawera LVZ; d a basaltic eruption from within the Haroharo LVZ; e a rhyolitic eruption from within the Haroharo LVZ; e a basaltic eruption from Ruawahia Dome, a single vent within the Tarawera LVZ (see star in Fig. 4); and f a rhyolitic eruption from Ruawahia Dome
Figure 8 in: Thompson, M. A., Lindsay, J. M., Sandri, L., Biass, S., Bonadonna, C., Jolly, G., & Marzocchi, W. (2015). Exploring the influence of vent location and eruption style on tephra fall hazard from the Okataina Volcanic Centre, New Zealand. Bulletin of volcanology, 77(5), 38. https://doi.org/10.1007/s00445-015-0926-y
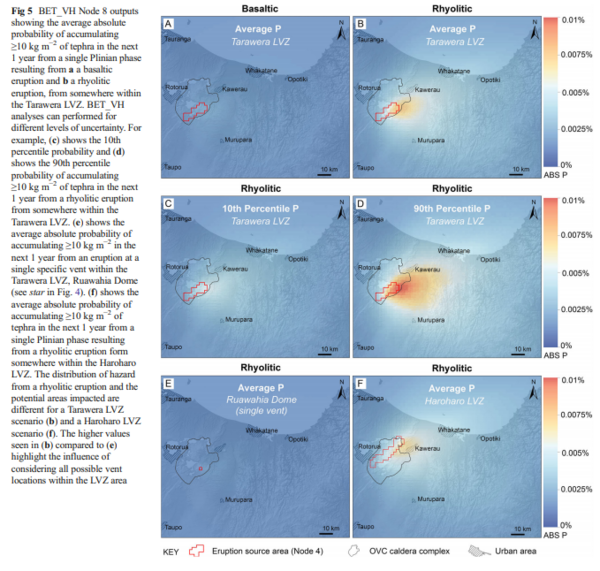
Figure in a journal article
BET_VH Node 8 outputs showing the average absolute probability of accumulating ≥10 kg m−2 of tephra in the next 1 year from a single Plinian phase resulting from a a basaltic eruption and b a rhyolitic eruption, from somewhere within the Tarawera LVZ
Figure 5 in: Thompson, M. A., Lindsay, J. M., Sandri, L., Biass, S., Bonadonna, C., Jolly, G., & Marzocchi, W. (2015). Exploring the influence of vent location and eruption style on tephra fall hazard from the Okataina Volcanic Centre, New Zealand. Bulletin of volcanology, 77(5), 38. https://doi.org/10.1007/s00445-015-0926-y
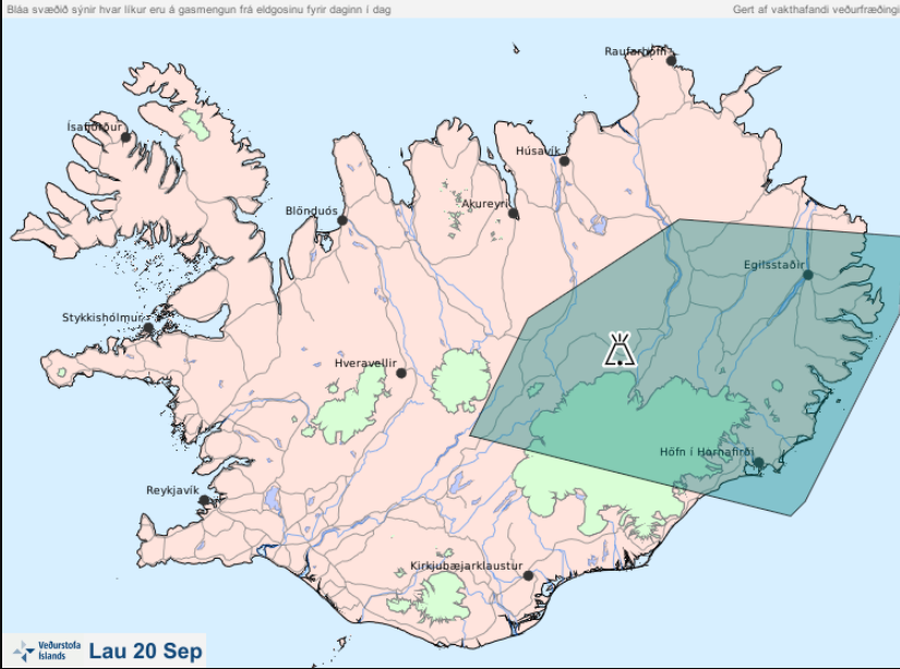
Official, Map in an information statement
Bláa svæðið sýnir hvar líkur eru á gasmengun frá eldgosinu fyrir daginn í dag lau 20 Sep
(The blue area shows the probability of gas pollution from the eruption before today Sat Sep 20)
Iceland Meteorological Office (IMO). (2014). Bláa svæðið sýnir hvar líkur eru á gasmengun frá eldgosinu fyrir daginn í dag lau 20 Sep