
Advanced Search for Maps
Showing 181-190 of 2217
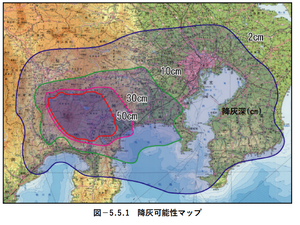
Official, Figure in hazard assessment
Ash fall possibility map
Figure 5.5.1 in: Mt. Fuji Hazard Map Review Committee. (2004). Mt. Fuji Hazard Map Review Committee Report. June 2004. https://www.bousai.go.jp/kazan/fuji_map/pdf/report_200406.pdf
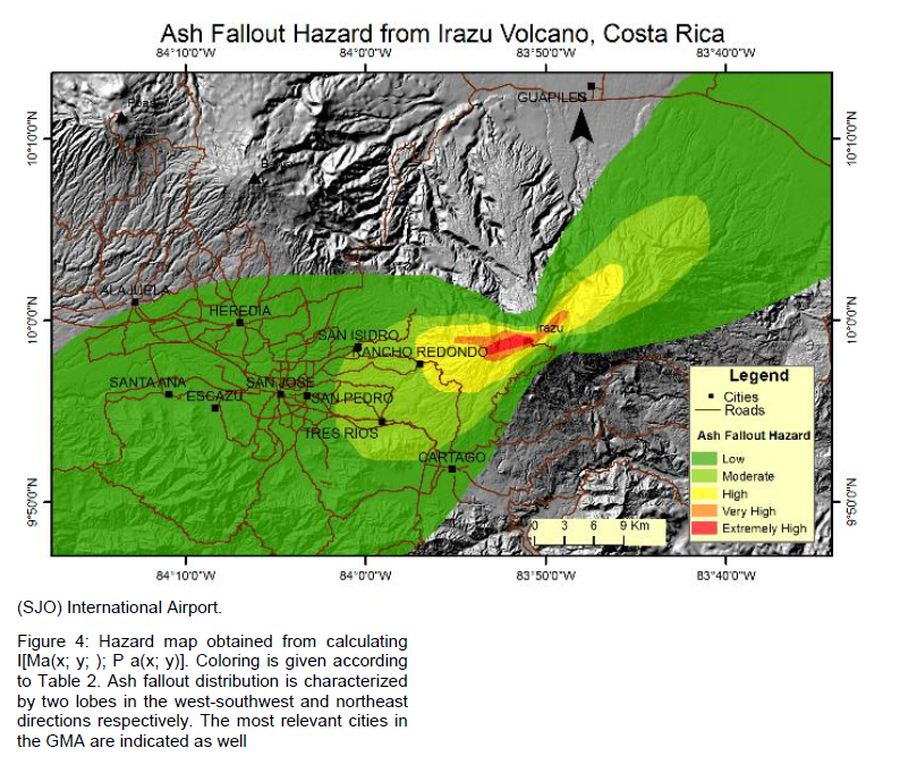
Figure in a journal article
Ash Fallout Hazard from Irazu Volcano, Costa Rica
Figure 4 in: Barrantes, G., Núñez, S., & Malavassi, E. (2018). Ash fallout hazard from Irazú volcano, Costa Rica. Revista Geográfica de Chile Terra Australis, 54(1), 13-25. https://doi.org/10.23854/07199562.2018541Barrantes13

Figure in a journal article
Ash fallout simulations (thickness) with a 5-km column height and volume of 0.3 km³
Figure 10 in: Bartolini, S., Geyer, A., Martí, J., Pedrazzi, D., & Aguirre-Díaz, G. (2014). Volcanic hazard on Deception Island (South Shetland Islands, Antarctica). Journal of Volcanology and Geothermal Research, 285, p. 150-168. https://doi.org/10.1016/j.jvolgeores.2014.08.009
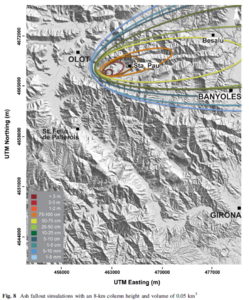
Figure in a journal article
Ash fallout simulations with an 8-km column height and volume of 0.05 km³
Figure 8 in: Bartolini, S., Bolós, X., Martí, J., Pedra, E. R., & Planagumà, L. (2015). Hazard assessment at the quaternary La Garrotxa volcanic field (NE Iberia). Natural Hazards, 78(2), 1349-1367. https://doi.org/10.1007/s11069-015-1774-y
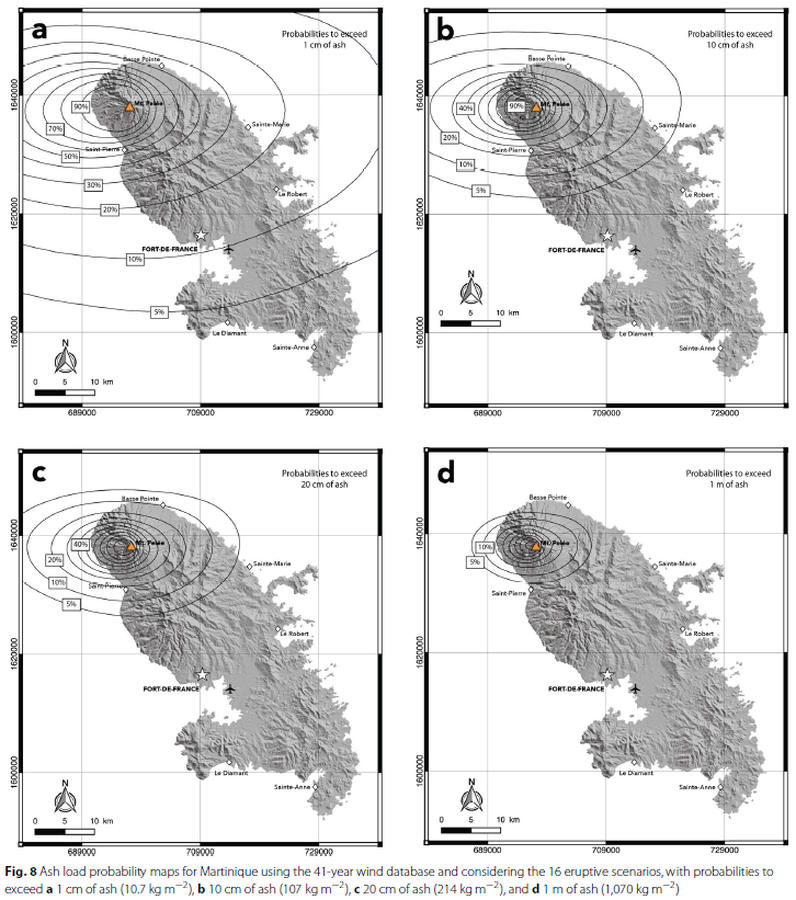
Figure in a journal article
Ash load probability maps for Martinique using the 41-year wind database and considering the 16 eruptive scenarios
Figure 8 in: Michaud-Dubuy, A., Carazzo, G., & Kaminski, E. (2021). Volcanic hazard assessment for tephra fallout in Martinique. Journal of Applied Volcanology, 10(1), 1-20. https://doi.org/10.1186/s13617-021-00106-7.
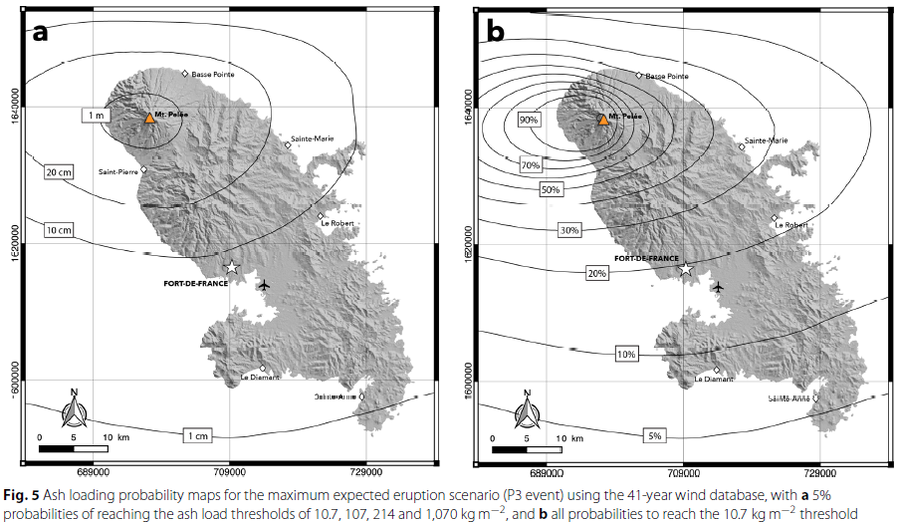
Figure in a journal article
Ash loading probability maps for the maximum expected eruption scenario
Figure 5 in: Michaud-Dubuy, A., Carazzo, G., & Kaminski, E. (2021). Volcanic hazard assessment for tephra fallout in Martinique. Journal of Applied Volcanology, 10(1), 1-20. https://doi.org/10.1186/s13617-021-00106-7.
Official, Figure in a journal article
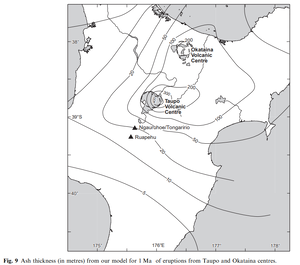
Ash thickness (in metres) from our model for 1 Ma of eruptions from Taupo and Okataina centres
Figure 9 in: Hurst, T. & Smith, W. (2010). Volcanic ashfall in New Zealand–probabilistic hazard modelling for multiple sources. New Zealand Journal of Geology and Geophysics, 53(1), 1-14. https://doi.org/10.1080/00288301003631129
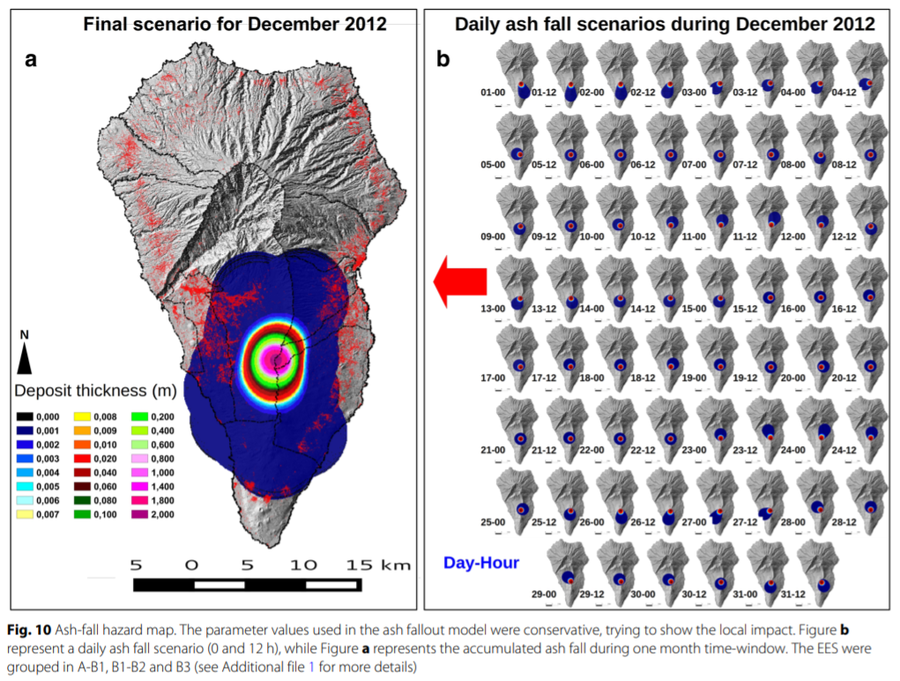
Figure in a journal article
Ash-fall hazard map
Figure 10 in: Marrero, J. M., García, A., Berrocoso, M., Llinares, Á., Rodríguez-Losada, A., & Ortiz, R. (2019). Strategies for the development of volcanic hazard maps in monogenetic volcanic fields: the example of La Palma (Canary Islands). Journal of Applied Volcanology, 8(1), 6. https://doi.org/10.1186/s13617-019-0085-5
Official, Map in an information statement
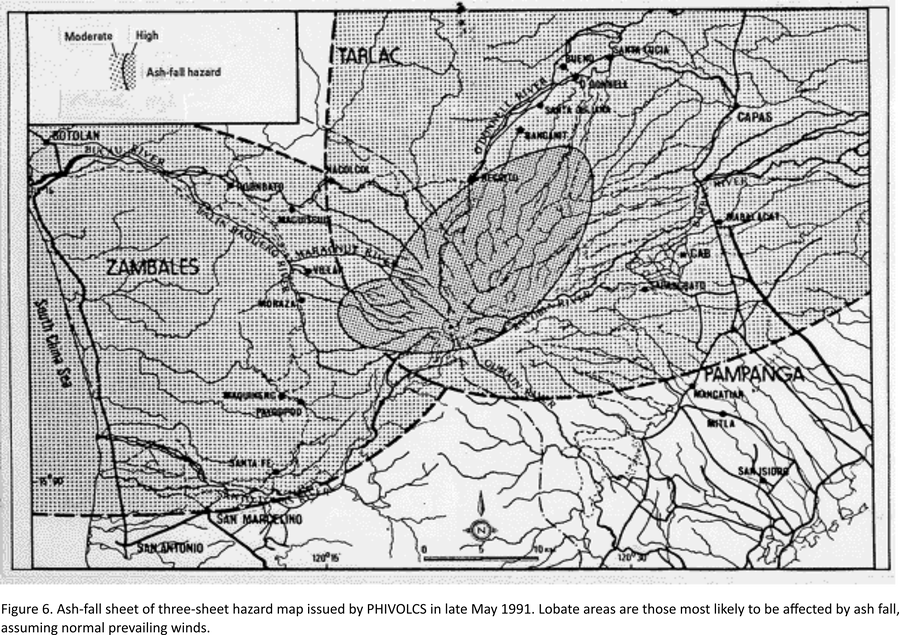
Ash-fall sheet of three-sheet hazard map issued by PHIVOLCS in late May 1991
Figure 6 in: Punongbayan, R.S., Newhall, C.G., Bautista, L.P., Garcia, D., Harlow, D.H., Hoblitt, R.P., Sabit, J.P., & Solidum, R.U. (1996). Eruption hazard assessments and warnings. In: Newhall, C.G. & Punongbayan, R.S. (Eds.) Fire and Mud: Eruptions and Lahars of Mount Pinatubo, Philippines. Philippine Institute of Volcanology and Seismology, Quezon City; University of Washington Press, Seattle.
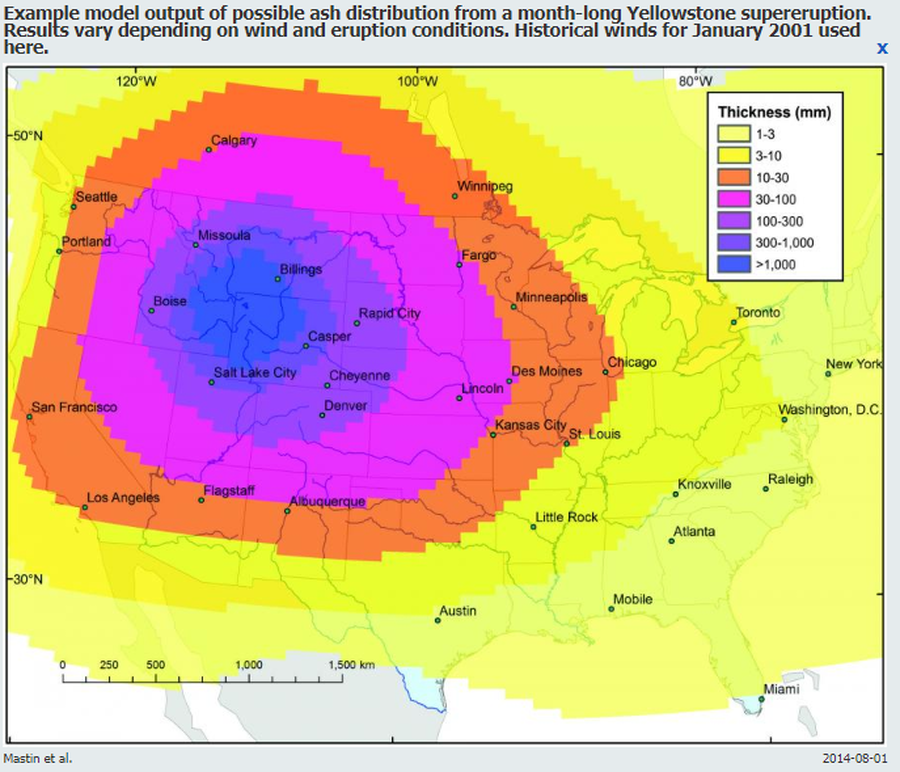
Official, Figure on website
Ashfall model output for Yellowstone supereruption
U.S. Geological Survey (USGS). (2014). Ashfall model output for Yellowstone supereruption. U.S. Geological Survey. Modeling the Ash Distribution of a Yellowstone Supereruption (2014). https://www.usgs.gov/volcanoes/yellowstone/modeling-ash-distribution-yellowstone-supereruption-2014 (Simplified from: Mastin et al. 2014)