
Advanced Search for Maps
Showing 41-50 of 509
Official, Map in an information statement
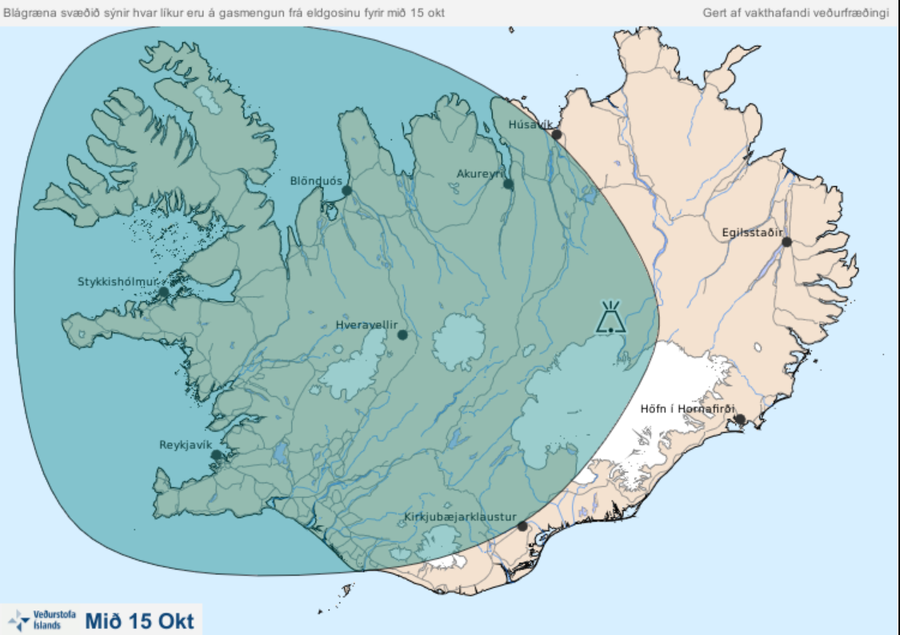
Blágræna svæðið sýnir hvar líkur eru á gasmengun frá eldgosinu fyrir mið 15 okt.
(The blue-green area shows the probability of gas pollution from the volcanic eruption by mid-15 oct.)
Iceland Meteorological Office (IMO). (2014). Blágræna svæðið sýnir hvar líkur eru á gasmengun frá eldgosinu fyrir mið 15 okt.
Official, Map in an information statement
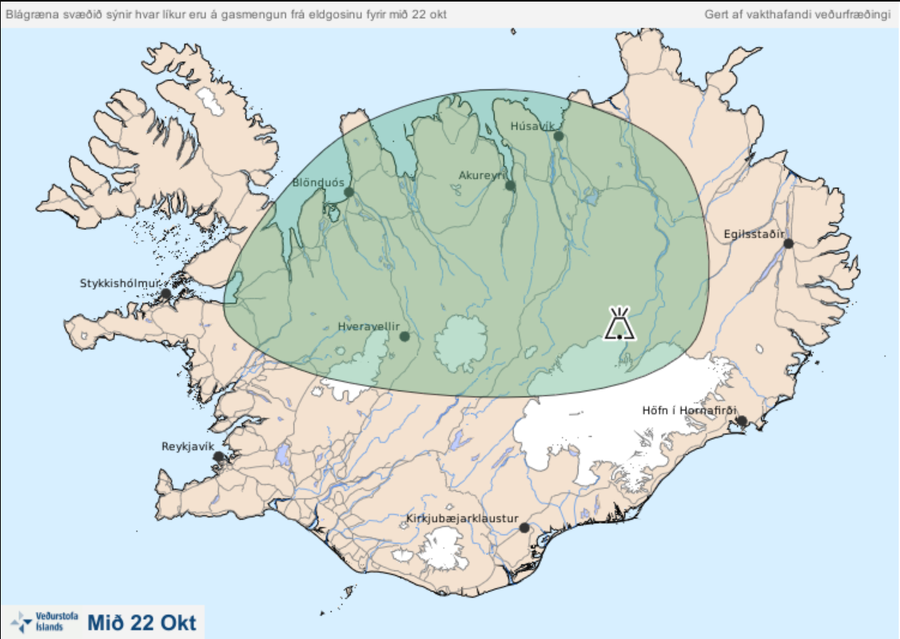
Blágræna svæðið sýnir hvar líkur eru á gasmengun frá eldgosinu fyrir mið 22 okt.
(The blue-green area shows the probability of gas pollution from the eruption by mid-22 October.)
Iceland Meteorological Office (IMO). (2014). Blágræna svæðið sýnir hvar líkur eru á gasmengun frá eldgosinu fyrir mið 22 okt.
Official, Map in an information statement
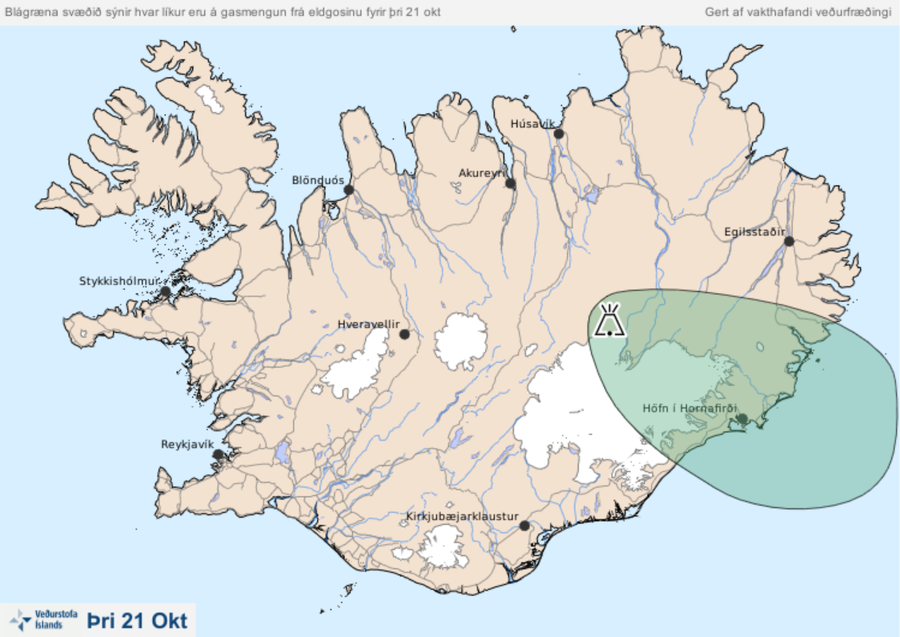
Blágræna svæðið sýnir hvar líkur eru á gasmengun frá eldgosinu fyrir mið þri 21 okt.
(The blue-green area shows the probability of gas pollution from the volcanic eruption by Mon Oct 21.)
Iceland Meteorological Office (IMO). (2014). Blágræna svæðið sýnir hvar líkur eru á gasmengun frá eldgosinu fyrir mið þri 21 okt.
Official, Map in an information statement
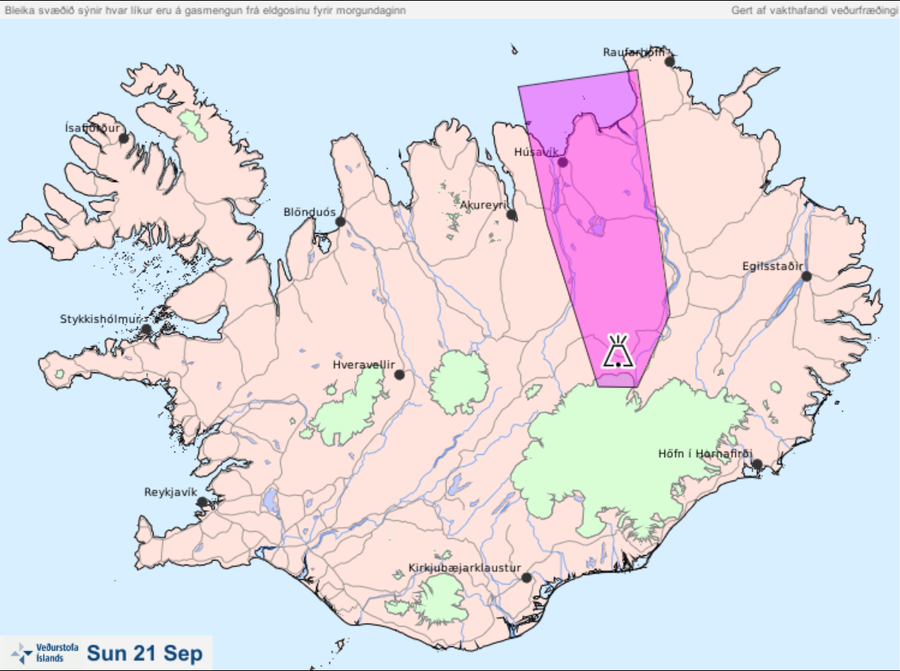
Bleika svæðið sýnir hvar líkur eru á gasmengun frá eldgosinu fyrir morgundaginn Sun 21 Sep
(The pale area shows the probability of gas pollution from the eruption before tomorrow Sun 21 Sep)
Iceland Meteorological Office (IMO). (2014). Bleika svæðið sýnir hvar líkur eru á gasmengun frá eldgosinu fyrir morgundaginn Sun 21 Sep
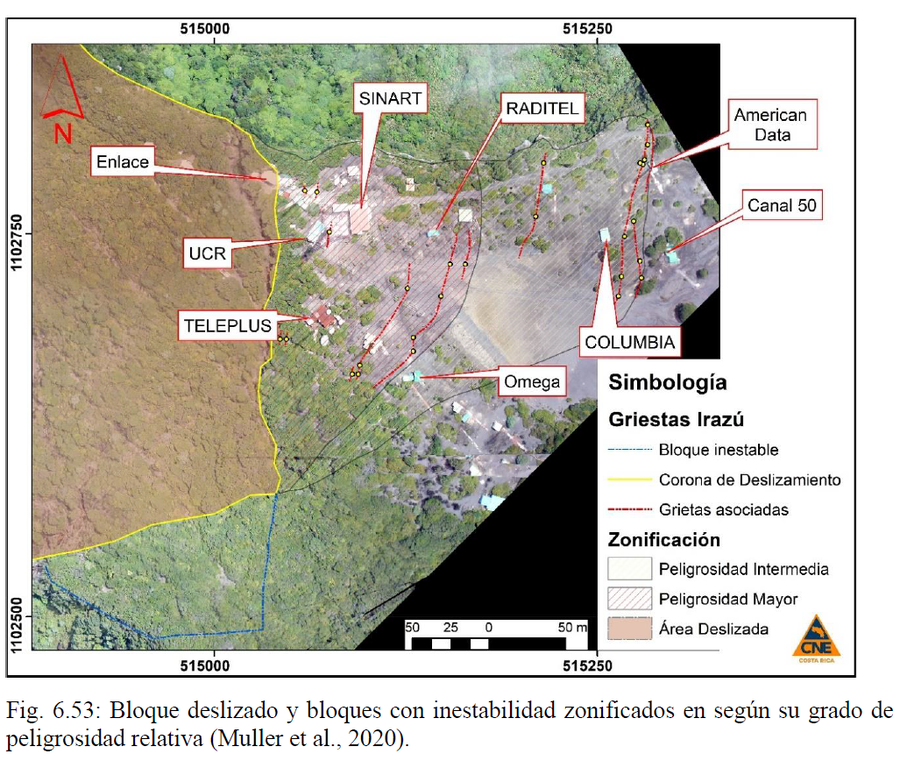
Official, Figure in hazard assessment
Bloque deslizado y bloques con inestabilidad zonificados en según su grado de peligrosidad relativa
(Sliding block and blocks with instability zoned according to their degree of relative danger)
Figure 6.53 in: Alvarado, G.E., Campos-Durán, D., Brenes-André, J., Alpízar, Y., Núñez, S., Esquivel, L., Sibaja, J.P. & Fallas, B. (2021). Peligro Volcánico del Irazú, Costa Rica. Comisión Nacional de Prevención de Riesgos y Atención de Emergencias (CNE). Deciembre 2021. (Modified from: Muller et al., 2020).
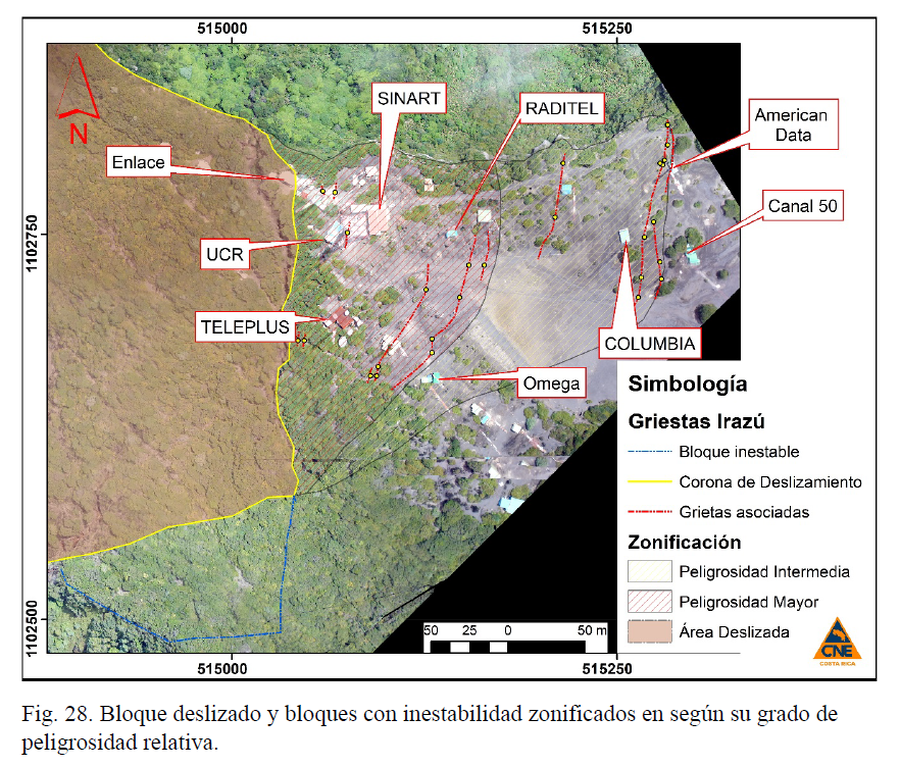
Official, Figure in hazard assessment
Bloque deslizado y bloques con inestabilidad zonificados en según su grado de peligrosidad relativa.
(Sliding block and blocks with instability zoned according to their degree of relative danger)
Figure 28 in: Muller, C., Pacheco, J., Angarita, M., Alvarado, G.E., Sánchez, B. & Avard, G. (2020). El deslizamiento de las Torres del Irazú del 2020 (Costa Rica): antecedentes, colapso y situación actual. OVSICORI-UNA y CNE. Informe Interno.
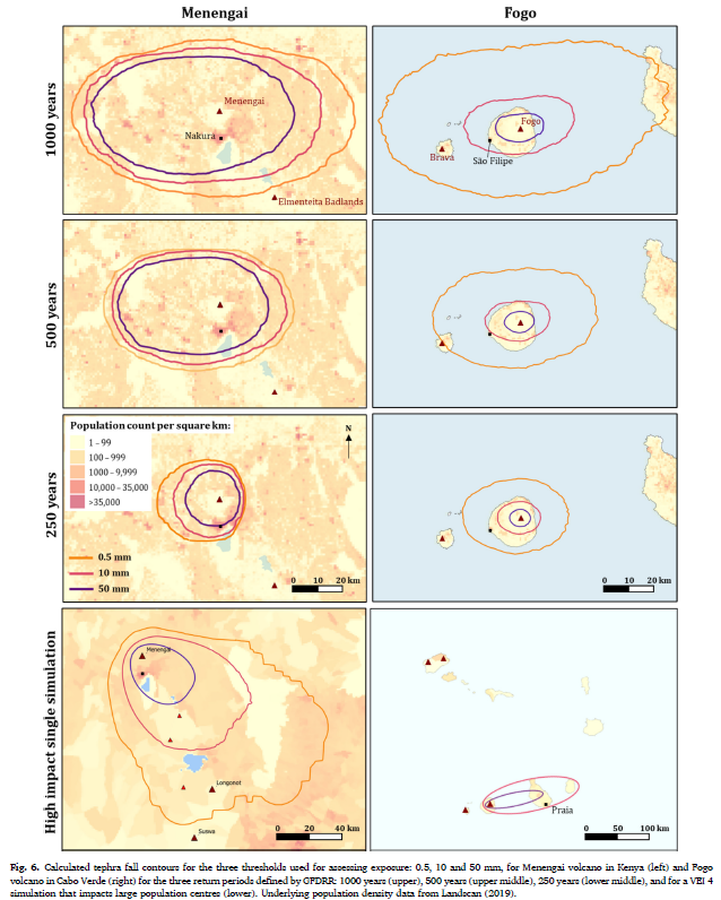
Figure in a journal article
Calculated tephra fall contours for the three thresholds used for assessing exposure: 0.5, 10 and 50 mm, for Menengai volcano in Kenya (left) and Fogo volcano in Cabo Verde (right) for the three return periods defined by GFDRR: 1000 years (upper), 500 years (upper middle), 250 years (lower middle), and for a VEI 4 simulation that impacts large population centres (lower)
Figure 6 in: Jenkins, S. F., Mee, K., Engwell, S. L., Loughlin, S. C., Faria, B. V. E., Yirgu, G., ... & Crummy, J. (2024). Assessing volcanic hazard and exposure in a data poor context: Case study for Ethiopia, Kenya, and Cabo Verde. Progress in Disaster Science, 23, 100350.
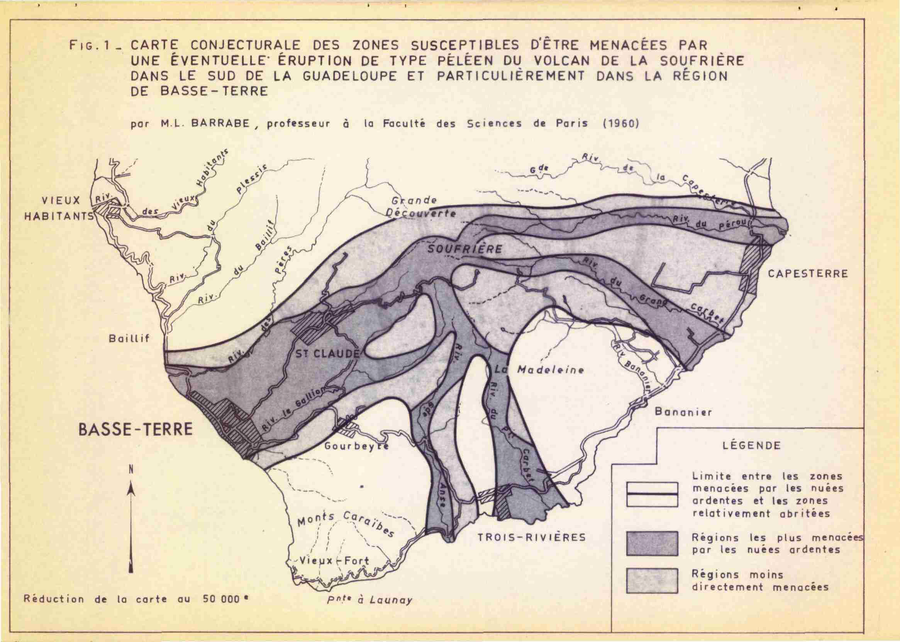
Official, Figure in hazard assessment
Carte Conjecturale des Zones Susceptibles d'etre Menacées par Une Éventuelle Éruption de Type Péleen du Volcan de la Soufrière dans le Sud de la Gaudeloupe et Particulièrement dans la Région de Basse-Terre
(Conjectural Map of Areas Susceptible to Threatened by a Possible Peleen-type Eruption of the Soufriere Volcano in the South of Gaudeloupe and Particularly in the Region of Basse-Terre)
Figure 1 (in reprint) in: Barrabe, M.L. (1960) Rapport sur les risques qui pourraient resulter de la presense du volcan de la Soufriere pour la villa de Basse-Terre, avec une carte de zonation des risques volcaniques au 1/50.000. Report inedit, 6 p. (Reprinted in: Westercamp, D. (1976). Dynamismes Éruptifs et Zonation des Risques Volcaniques a la Sourfrière de Guadeloupe. Bureau de Recherches Géologiques, Service Geologique des Antilles. Reprinted from: Barrabe, M.L. (1960) Rapport sur les risques qui pourraient resulter de la presense du volcan de la Soufriere pour la villa de Basse-Terre, avec une carte de zonation des risques volcaniques au 1/50.000. Report inedit, 6 p.)
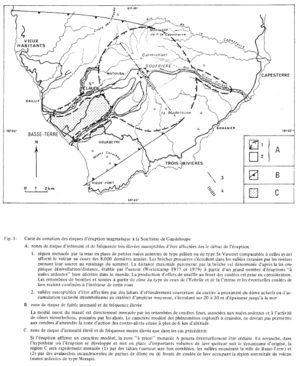
Figure in a journal article
Carte de zonation des risques d'éruption magmatique à la Soufrière de Guadeloupe
(Zonation map of magmatic eruption risks at Soufrière in Guadeloupe)
Figure 5 in: Westercamp, D. (1981). Cartographie du risque volcanique a la soufriere de guadeloupe: Retrospective et tendance actuelle. Bulletin of the International Association of Engineering Geology-Bulletin de l'Association Internationale de Géologie de l'Ingénieur, 23(1), p. 25-32. https://doi.org/10.1007/BF02594723
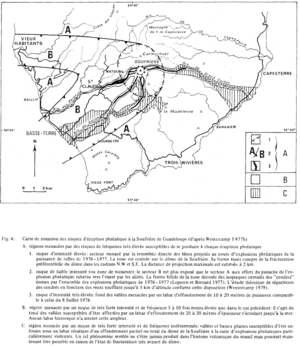
Figure in a journal article
Carte de zonation des risques d'éruption phréatique à la Soufrière de Guadeloupe (d'après Westercamp 1977b)
(Zonation map of phreatic eruption risks at Soufrière in Guadeloupe (from Westercamp 1977b))
Figure 4 in: Westercamp, D. (1981). Cartographie du risque volcanique a la soufriere de guadeloupe: Retrospective et tendance actuelle. Bulletin of the International Association of Engineering Geology-Bulletin de l'Association Internationale de Géologie de l'Ingénieur, 23(1), p. 25-32. https://doi.org/10.1007/BF02594723