
Advanced Search for Maps
Showing 11-20 of 139
Official, Figure in hazard assessment
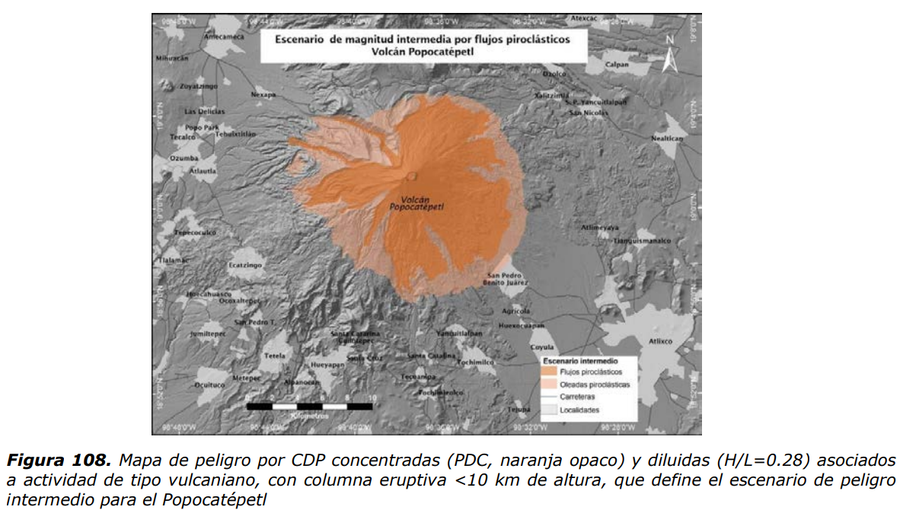
Escenario de magnitud intermedia por flujos piroclásticos Volcan Popocatépetl
(Intermediate magnitude scenario due to pyroclastic flows Popocatépetl Volcano)
Figure 108 in: Martin Del Pozzo, A.L, Alatorre Ibargüengoitia M., Arana Salinas L., Bonasia R., Capra Pedol L., Cassata W., Cordoba G., Cortés Ramos J., Delgado Granados H., Ferrés López M.D., Fonseca Álvarez R., García Reynoso J.A., Gisbert G., Guerrero López D.A., Jaimes Viera M., Macías Vázquez J.L., Nieto Obregon J., Nieto Torres A., Paredes Ruiz P.A., Portocarrero Martínez J., Renne P., Rodríguez Espinosa D.M., Salinas Sánchez S., Siebe Grabach C., & Tellez Ugalde E. (2017). Estudios geológicos y actualización del mapa de peligros del volcán Popocatépetl. Memoria técnica del mapa de peligros del volcán Popocatépetl. Instituto de Geofísica, Universidad Nacional Autónoma de México (UNAM).
Official, Figure in hazard assessment
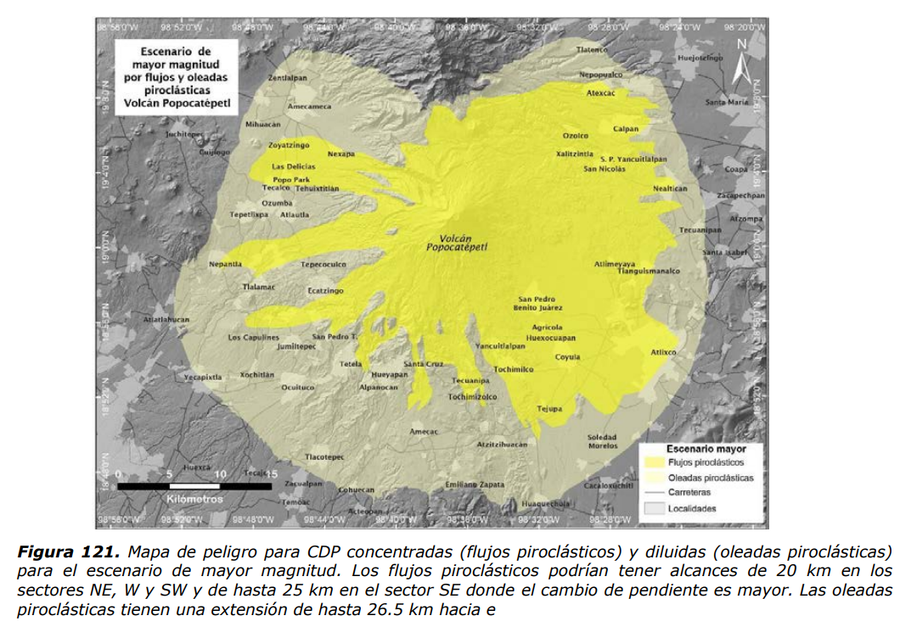
Escenario de mayor magnitud por flujos y oleadas piroclásticas Volcán Popocatépetl
(Greater magnitude scenario due to pyroclastic flows and surges Popocatépetl Volcano)
Figure 121 in: Martin Del Pozzo, A.L, Alatorre Ibargüengoitia M., Arana Salinas L., Bonasia R., Capra Pedol L., Cassata W., Cordoba G., Cortés Ramos J., Delgado Granados H., Ferrés López M.D., Fonseca Álvarez R., García Reynoso J.A., Gisbert G., Guerrero López D.A., Jaimes Viera M., Macías Vázquez J.L., Nieto Obregon J., Nieto Torres A., Paredes Ruiz P.A., Portocarrero Martínez J., Renne P., Rodríguez Espinosa D.M., Salinas Sánchez S., Siebe Grabach C., & Tellez Ugalde E. (2017). Estudios geológicos y actualización del mapa de peligros del volcán Popocatépetl. Memoria técnica del mapa de peligros del volcán Popocatépetl. Instituto de Geofísica, Universidad Nacional Autónoma de México (UNAM).
Official, Figure in hazard assessment
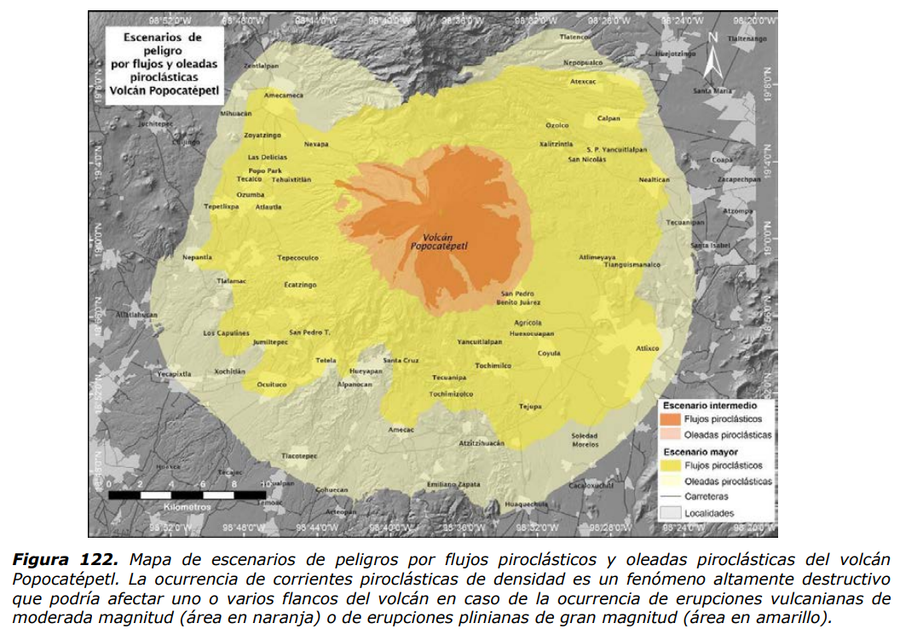
Escenarios de peligro por flujos y oleadas piroclásticas Volcán Popocatépetl
(Hazard scenarios due to pyroclastic flows and surges Popocatépetl Volcano)
Figure 122 in: Martin Del Pozzo, A.L, Alatorre Ibargüengoitia M., Arana Salinas L., Bonasia R., Capra Pedol L., Cassata W., Cordoba G., Cortés Ramos J., Delgado Granados H., Ferrés López M.D., Fonseca Álvarez R., García Reynoso J.A., Gisbert G., Guerrero López D.A., Jaimes Viera M., Macías Vázquez J.L., Nieto Obregon J., Nieto Torres A., Paredes Ruiz P.A., Portocarrero Martínez J., Renne P., Rodríguez Espinosa D.M., Salinas Sánchez S., Siebe Grabach C., & Tellez Ugalde E. (2017). Estudios geológicos y actualización del mapa de peligros del volcán Popocatépetl. Memoria técnica del mapa de peligros del volcán Popocatépetl. Instituto de Geofísica, Universidad Nacional Autónoma de México (UNAM).
Official, Figure in hazard assessment
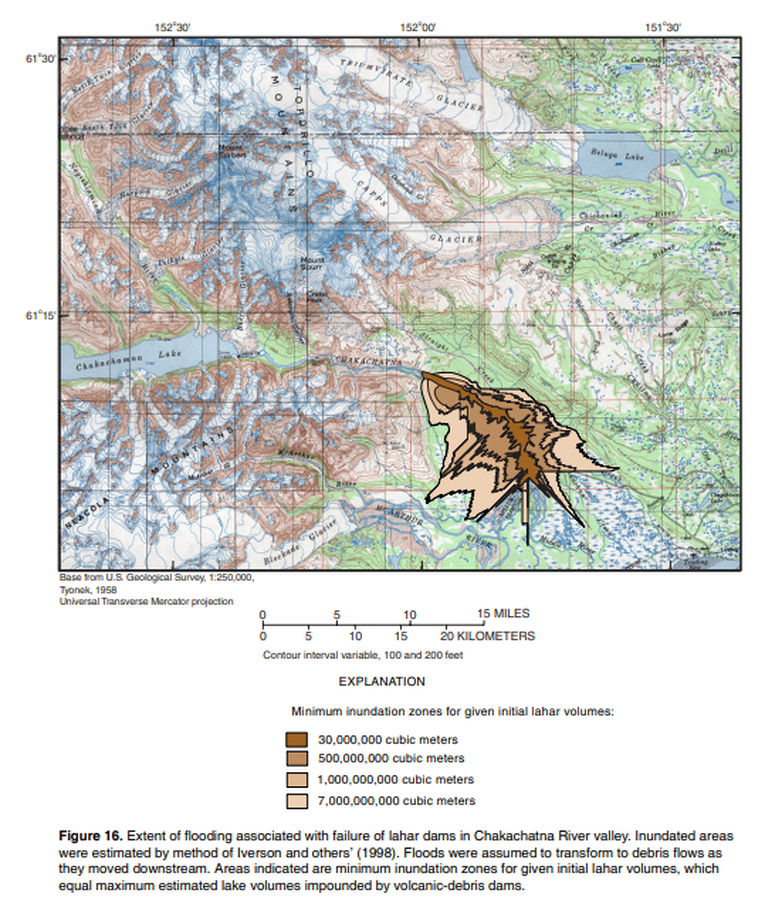
Extent of flooding associated with failure of lahar dams in Chakachatna River
Figure 16 in: Waythomas, C.F. & Nye, C.J. (2002). Preliminary volcano-hazard assessment for Mount Spurr Volcano, Alaska. U.S. Geological Survey, Open-File Report 2001-482, 40 p., 1 plate. https://doi.org/10.3133/ofr01482
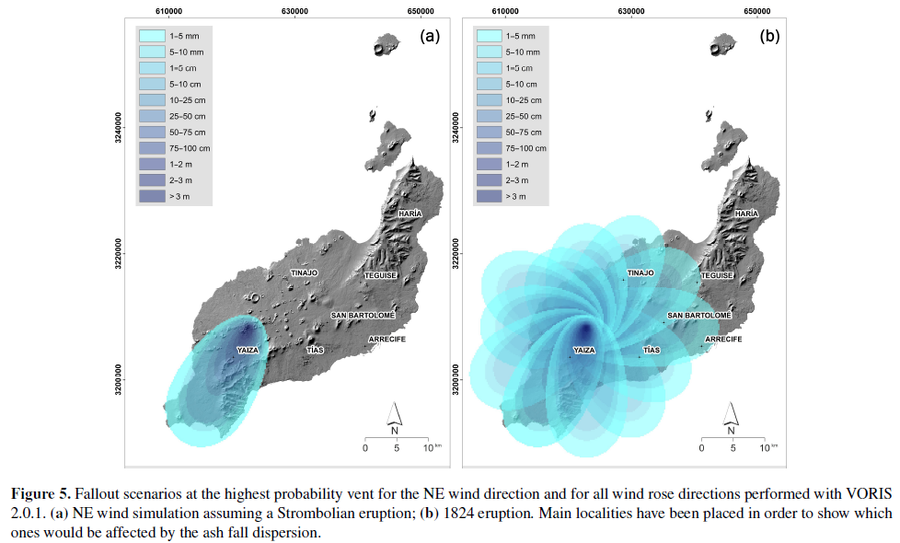
Figure in a journal article
Fallout scenarios at the highest probability vent for the NE wind direction and for all wind rose directions performed with VORIS 2.0.1
Figure 5 in: Becerril, L., Martí, J., Bartolini, S., & Geyer, A. (2017). Assessing qualitative long-term volcanic hazards at Lanzarote Island (Canary Islands). Natural Hazards and Earth System Sciences, 17(7), 1145-1157. https://doi.org/10.5194/nhess-17-1145-2017
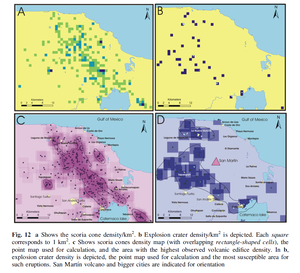
Figure in a journal article
Fig. 12 a Shows the scoria cone density/km². b Explosion crater density/km² is depicted. Each square corresponds to 1 km2. c Shows scoria cones density map (with overlapping rectangle-shaped cells), the point map used for calculation, and the area with the highest observed volcanic edifice density.
Figure 12 in: Sieron, K., Capra, L., & Rodríguez-Elizararrás, S. (2014). Hazard assessment at San Martín volcano based on geological record, numerical modeling, and spatial analysis. Natural hazards, 70(1), 275-297. https://doi.org/10.1007/s11069-013-0807-7
Official, Insert/poster-size map with accompanying report
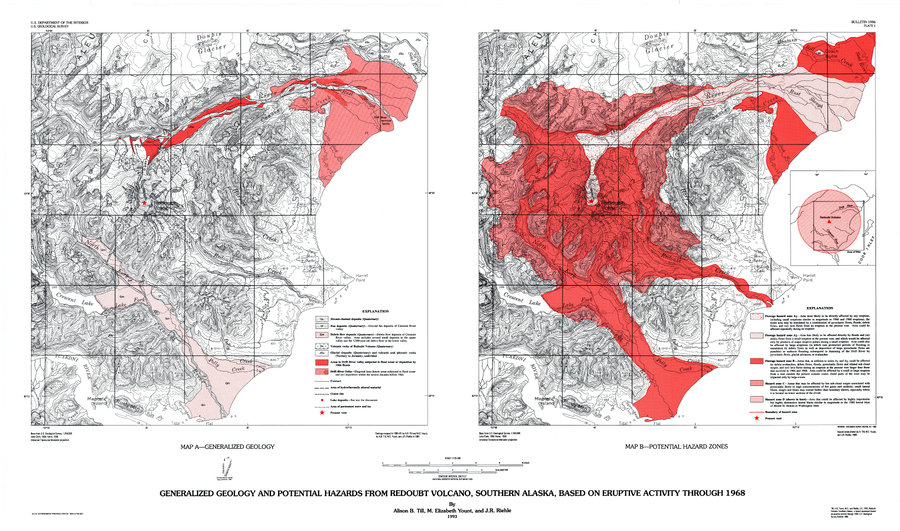
Generalized Geology and Potential Hazards from Redoubt Volcano, Southern Alaska, Based on Eruptive Activity Through 1968
Plate 1 in: Till, A.B., Yount, M.E., & Riehle, J.R. (1993). Redoubt Volcano, southern Alaska; a hazard assessment based on eruptive activity through 1968. U.S. Geological Survey, Bulletin 1996, 19 p., 1 plate. https://doi.org/10.3133/b1996
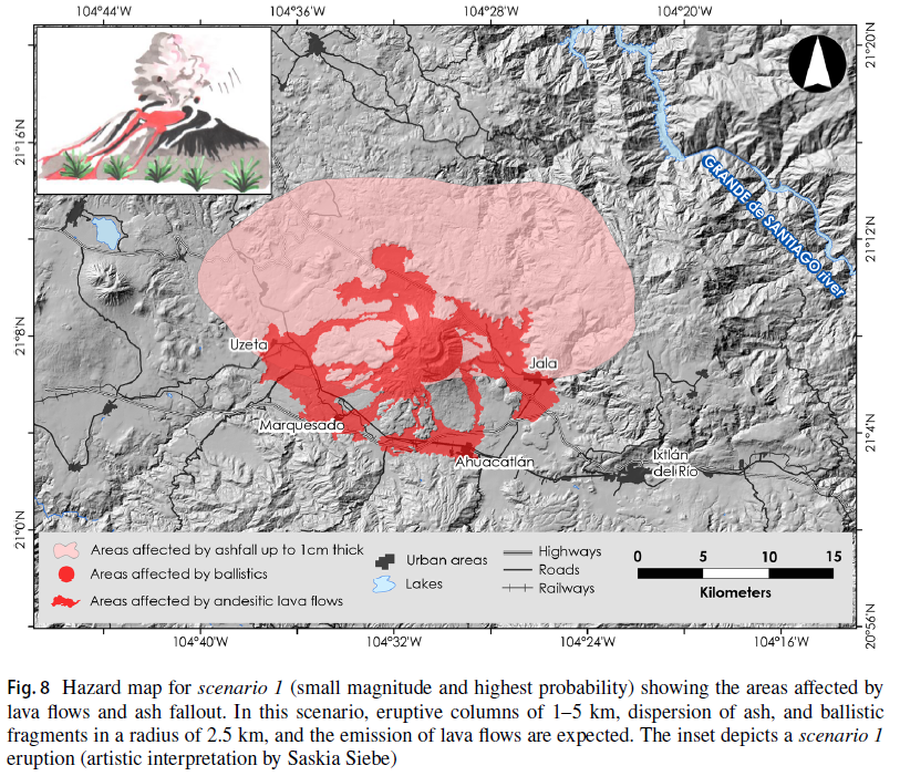
Figure in a journal article
Hazard map for scenario 1 (small magnitude and highest probability) showing the areas affected by lava flows and ash fallout
Figure 8 in: Sieron, K., Ferrés, D., Siebe, C., Constantinescu, R., Capra, L., Connor, C., Connor, L., Groppelli, G. & Zuccolotto, K.G. (2019). Ceboruco hazard map: part II—modeling volcanic phenomena and construction of the general hazard map. Natural Hazards, 96(2), p. 893-933. https://doi.org/10.1007/s11069-019-03577-5
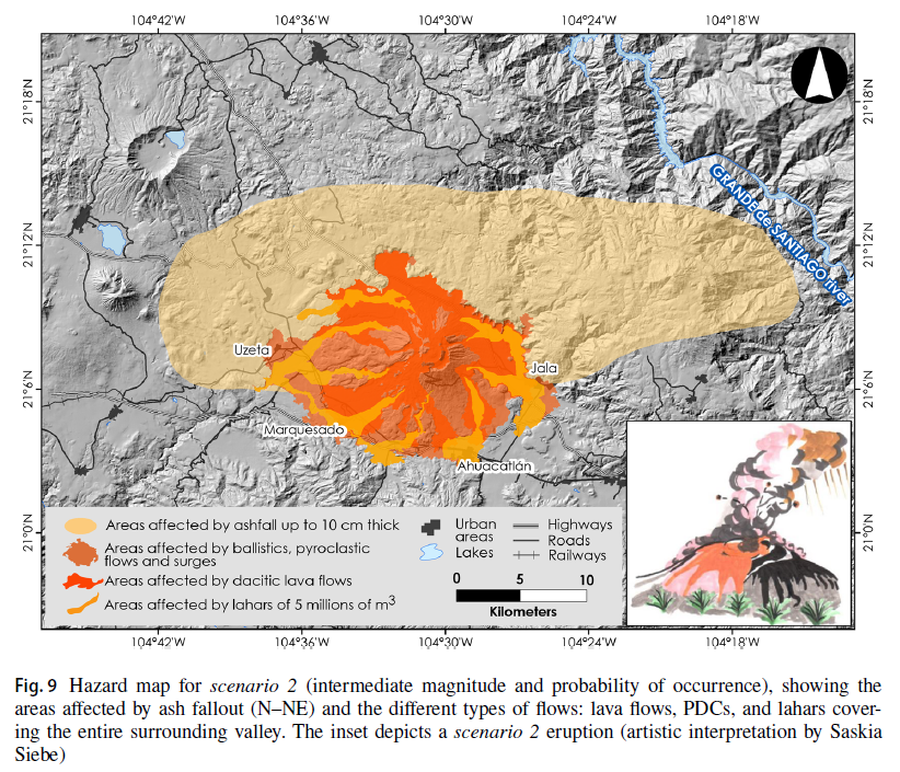
Figure in a journal article
Hazard map for scenario 2 (intermediate magnitude and probability of occurrence), showing the areas affected by ash fallout (N–NE) and the different types of flows: lava flows, PDCs, and lahars covering the entire surrounding valley
Figure 9 in: Sieron, K., Ferrés, D., Siebe, C., Constantinescu, R., Capra, L., Connor, C., Connor, L., Groppelli, G. & Zuccolotto, K.G. (2019). Ceboruco hazard map: part II—modeling volcanic phenomena and construction of the general hazard map. Natural Hazards, 96(2), p. 893-933. https://doi.org/10.1007/s11069-019-03577-5
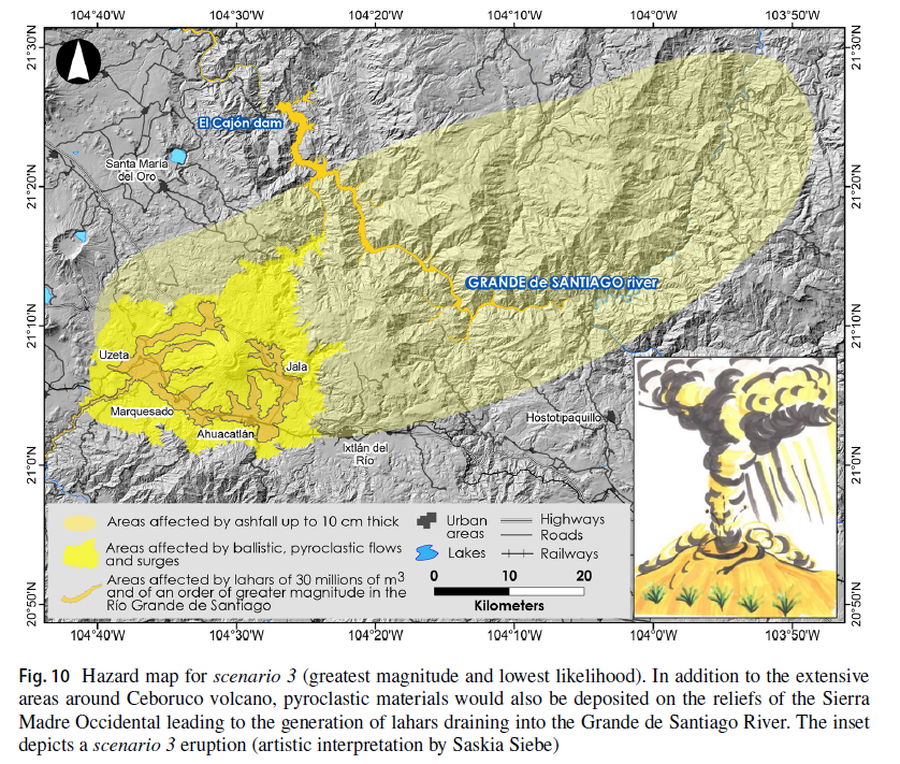
Figure in a journal article
Hazard map for scenario 3 (greatest magnitude and lowest likelihood)
Figure 10 in: Sieron, K., Ferrés, D., Siebe, C., Constantinescu, R., Capra, L., Connor, C., Connor, L., Groppelli, G. & Zuccolotto, K.G. (2019). Ceboruco hazard map: part II—modeling volcanic phenomena and construction of the general hazard map. Natural Hazards, 96(2), p. 893-933. https://doi.org/10.1007/s11069-019-03577-5