
Advanced Search for Maps
Showing 21-30 of 180
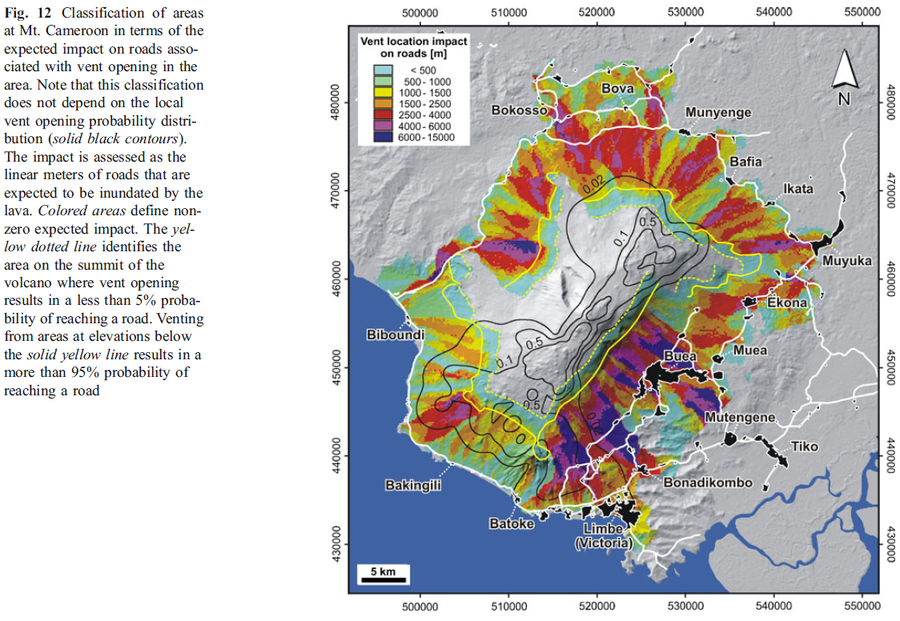
Figure in a journal article
Classification of areas at Mt. Cameroon in terms of the expected impact on roads associated with vent opening in the area
Figure 12 in: Favalli, M., Tarquini, S., Papale, P., Fornaciai, A., & Boschi, E. (2012). Lava flow hazard and risk at Mt. Cameroon volcano. Bulletin of Volcanology, 74(2), 423-439. https://doi.org/10.1007/s00445-011-0540-6
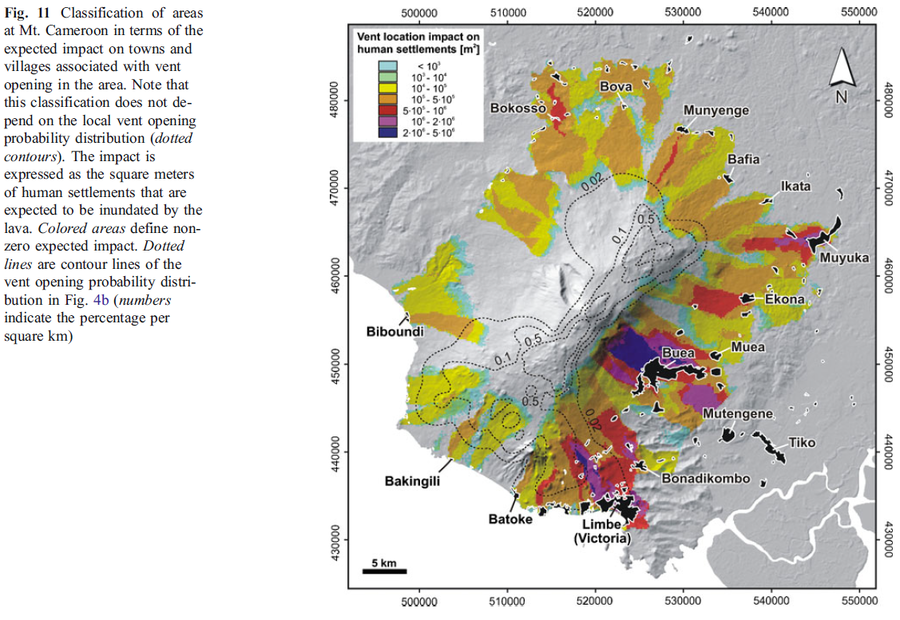
Figure in a journal article
Classification of areas at Mt. Cameroon in terms of the expected impact on towns and villages associated with vent opening in the area
Figure 11 in: Favalli, M., Tarquini, S., Papale, P., Fornaciai, A., & Boschi, E. (2012). Lava flow hazard and risk at Mt. Cameroon volcano. Bulletin of Volcanology, 74(2), 423-439. https://doi.org/10.1007/s00445-011-0540-6
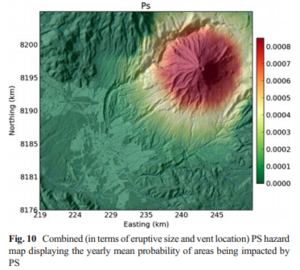
Figure in a journal article
Combined (in terms of eruptive size and vent location) PS hazard map displaying the yearly mean probability of areas being impacted by PS
Figure 10 in: Sandri, L., Thouret, J. C., Constantinescu, R., Biass, S., & Tonini, R. (2014). Long-term multi-hazard assessment for El Misti volcano (Peru). Bulletin of volcanology, 76(2), 771. https://doi.org/10.1007/s00445-013-0771-9
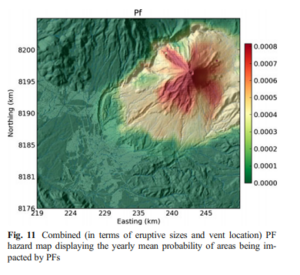
Figure in a journal article
Combined (in terms of eruptive sizes and vent location) PF hazard map displaying the yearly mean probability of areas being impacted by PFs
Figure 11 in: Sandri, L., Thouret, J. C., Constantinescu, R., Biass, S., & Tonini, R. (2014). Long-term multi-hazard assessment for El Misti volcano (Peru). Bulletin of volcanology, 76(2), 771. https://doi.org/10.1007/s00445-013-0771-9
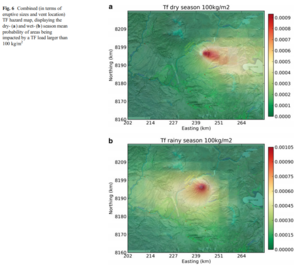
Figure in a journal article
Combined (in terms of eruptive sizes and vent location) TF hazard map, displaying the dry- and wet-season mean probability of areas being impacted by a TF load larger than 100 kg/m²
Figure 6 in: Sandri, L., Thouret, J. C., Constantinescu, R., Biass, S., & Tonini, R. (2014). Long-term multi-hazard assessment for El Misti volcano (Peru). Bulletin of volcanology, 76(2), 771. https://doi.org/10.1007/s00445-013-0771-9
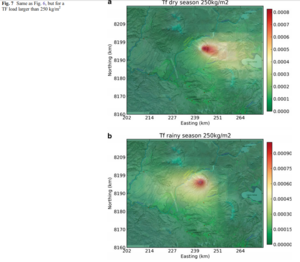
Figure in a journal article
Combined (in terms of eruptive sizes and vent location) TF hazard map, displaying the dry- and wet-season mean probability of areas being impacted by a TF load larger than 250 kg/m²
Figure 7 in: Sandri, L., Thouret, J. C., Constantinescu, R., Biass, S., & Tonini, R. (2014). Long-term multi-hazard assessment for El Misti volcano (Peru). Bulletin of volcanology, 76(2), 771. https://doi.org/10.1007/s00445-013-0771-9
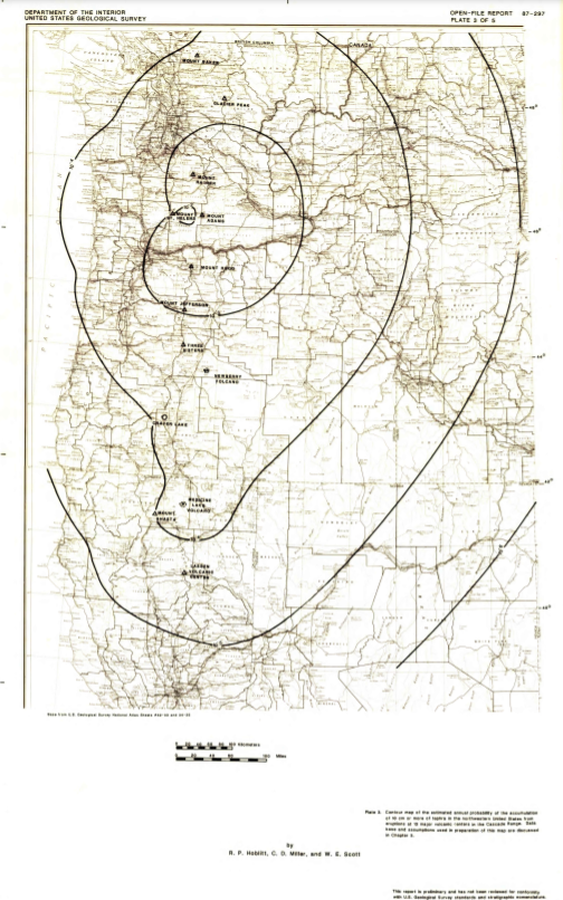
Official, Insert/poster-size map with accompanying report
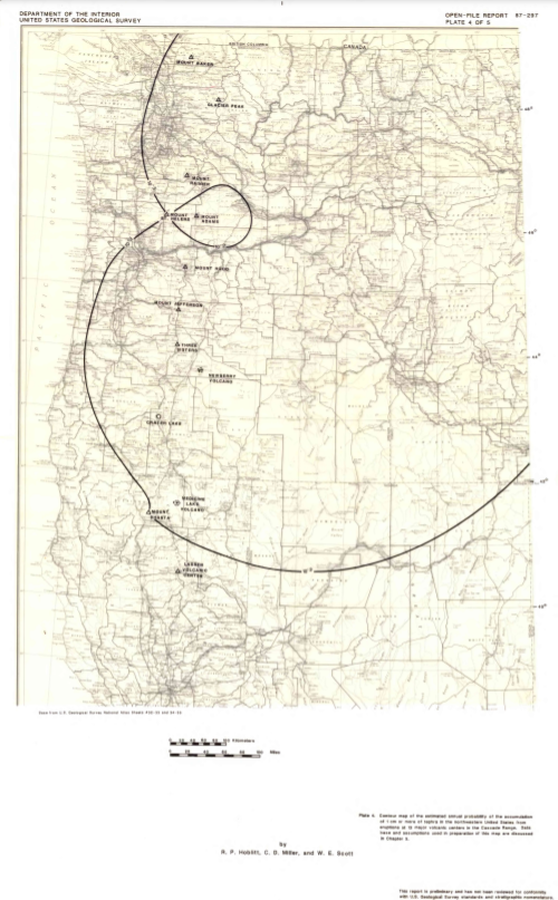
Contour map of the estimated annual probability of the accumulation of 1 cm or more of tephra in the northwestern United States at eruptions at 13 major volcanic centers in the Cascades Range
Plate 4 in: Hoblitt, R. P., Miller, C. D., & Scott, W. E. (1987). Volcanic hazards with regard to siting nuclear-power plants in the Pacific Northwest. U.S. Geological Survey, Open-File Report 87-297. https://doi.org/10.3133/ofr87297
Official, Insert/poster-size map with accompanying report
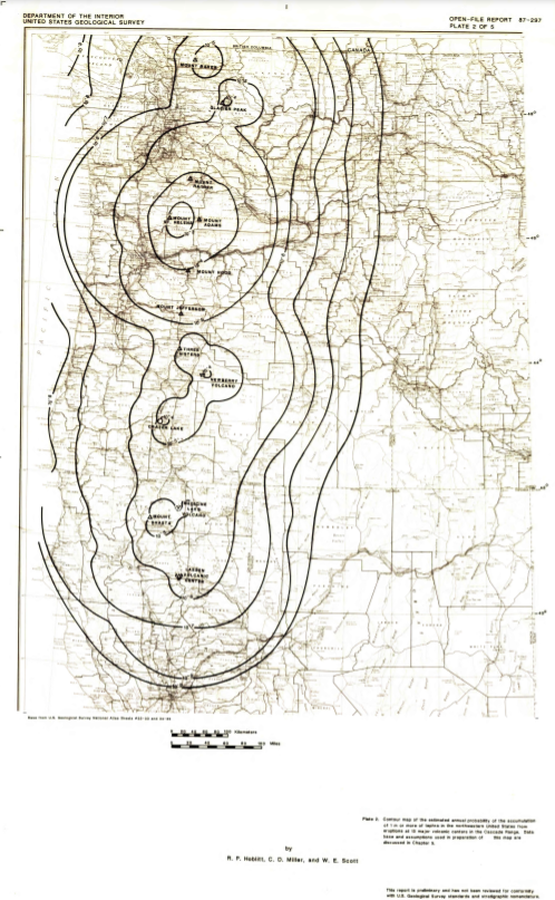
Contour map of the estimated annual probability of the accumulation of 1 m or more of tephra in the northwestern United States at eruptions at 13 major volcanic centers in the Cascades Range
Plate 2 in: Hoblitt, R. P., Miller, C. D., & Scott, W. E. (1987). Volcanic hazards with regard to siting nuclear-power plants in the Pacific Northwest. U.S. Geological Survey, Open-File Report 87-297. https://doi.org/10.3133/ofr87297
Official, Insert/poster-size map with accompanying report
Contour map of the estimated annual probability of the accumulation of 10 cm or more of tephra in the northwestern United States at eruptions at 13 major volcanic centers in the Cascades Range
Plate 3 in: Hoblitt, R. P., Miller, C. D., & Scott, W. E. (1987). Volcanic hazards with regard to siting nuclear-power plants in the Pacific Northwest. U.S. Geological Survey, Open-File Report 87-297. https://doi.org/10.3133/ofr87297

Figure in a journal article
Early simulations carried out before the onset of the effusive eruption
Figure 4 in: Tarquini, S., de'Michieli Vitturi, M., Jensen, E. H., Pedersen, G. B., Barsotti, S., Coppola, D., & Pfeffer, M. A. (2018). Modeling lava flow propagation over a flat landscape by using MrLavaLoba: the case of the 2014–2015 eruption at Holuhraun, Iceland. Annals of Geophysics. https://doi.org/10.4401/ag-7812