
Advanced Search for Maps
Showing 41-50 of 180
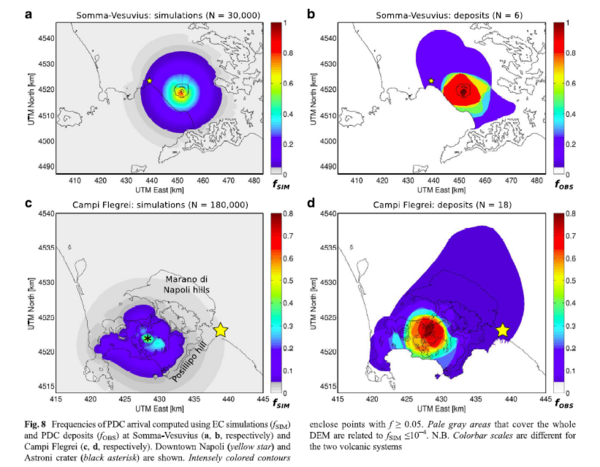
Figure in a journal article
Frequencies of PDC arrival computed using EC simulations and PDC deposits at Somma-Vesuvius and Campi Flegrei
Figure 8c-d in: Tierz, P., Sandri, L., Costa, A., Zaccarelli, L., Di Vito, M. A., Sulpizio, R., & Marzocchi, W. (2016). Suitability of energy cone for probabilistic volcanic hazard assessment: validation tests at Somma-Vesuvius and Campi Flegrei (Italy). Bulletin of Volcanology, 78(11). https://doi.org/10.1007/s00445-016-1073-9
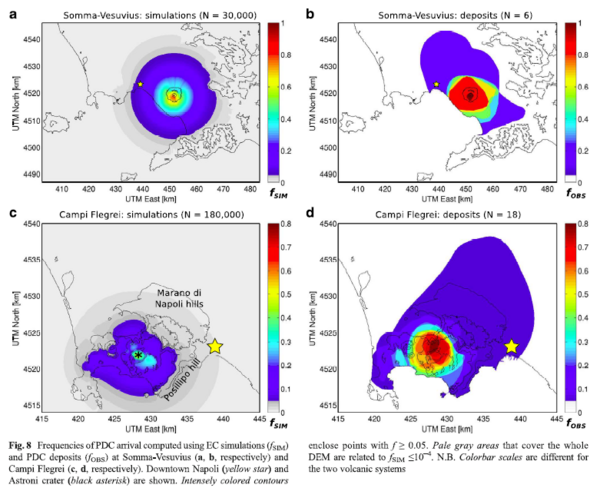
Figure in a journal article
Frequencies of PDC arrival computed using EC simulations and PDC deposits at Somma-Vesuvius and Campi Flegrei
Figure 8a-b in: Tierz, P., Sandri, L., Costa, A., Zaccarelli, L., Di Vito, M. A., Sulpizio, R., & Marzocchi, W. (2016). Suitability of energy cone for probabilistic volcanic hazard assessment: validation tests at Somma-Vesuvius and Campi Flegrei (Italy). Bulletin of Volcanology, 78(11). https://doi.org/10.1007/s00445-016-1073-9
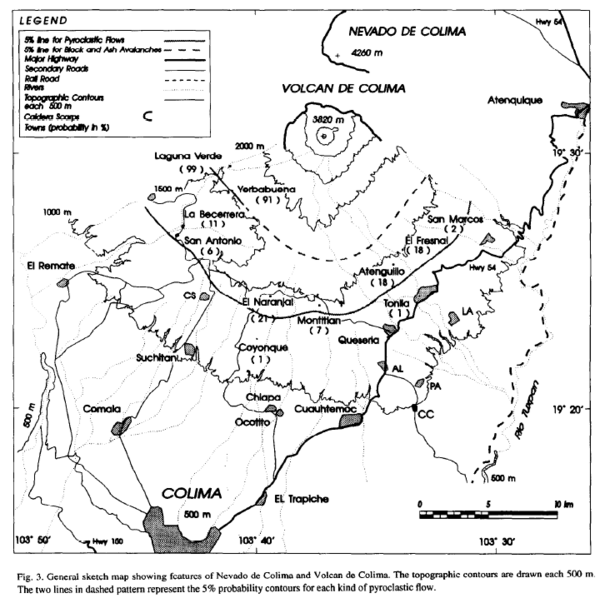
Figure in a journal article
General sketch map showing features of Nevado de Colima and Volcan de Colima
Figure 3 in: Sheridan, M.F., & Macías, J. (1995). Estimation of risk probability for gravity-driven pyroclastic flows at Volcan Colima, Mexico. Journal of Volcanology and Geothermal Research, 66(1-4), p. 251-256. https://doi.org/10.1016/0377-0273(94)00058-O
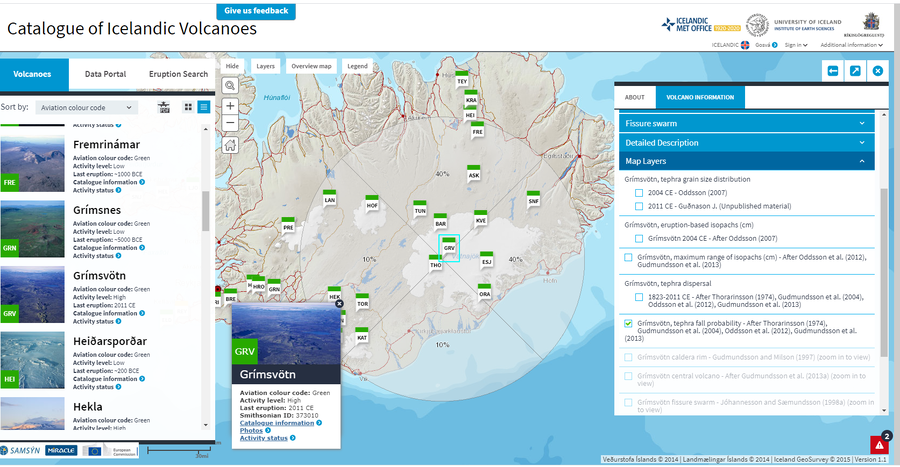
Official, Interactive web-based map
Grímsvötn, tephra fall probability - After Thorarinsson (1974), Gudmundsson et al. (2004), Oddsson et al. (2012), Gudmundsson et al. (2013)
Guðmundsson, M.T. & Larsen, G. (2019). Grímsvötn. In: Oladottir, B., Larsen, G. & Guðmundsson, M. T. Catalogue of Icelandic Volcanoes. Iceland Meteorological Office (IMO), Univeristy of Iceland, and Civil Protection Department of the National Commissioner of the Iceland Police (CPD-NCIP). (Simplified from: Thorarinsson 1974, Gudmundsson et al. 2004, Oddsson et al. 2012, Gudmundsson et al. 2013)
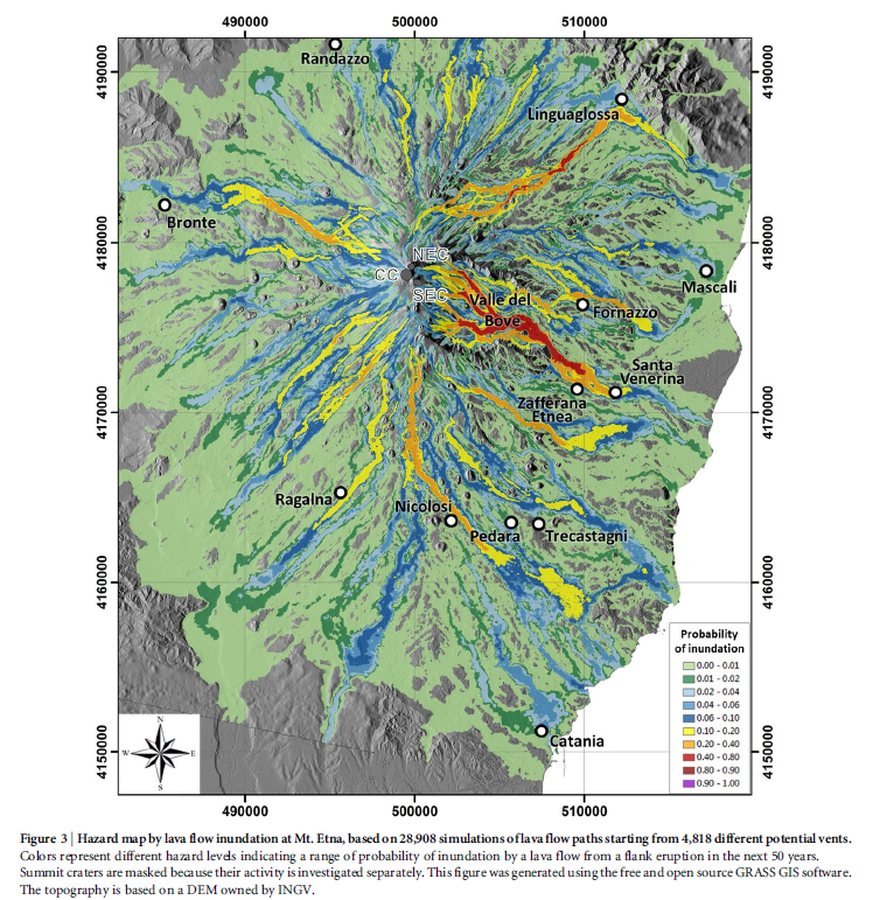
Figure in a journal article
Hazard map by lava flow inundation at Mt. Etna, based on 28,908 simulations of lava flow paths starting from 4,818 different potential vents.
Figure 3 in: Del Negro, C., Cappello, A., Neri, M., Bilotta, G., Hérault, A., & Ganci, G. (2013). Lava flow hazards at Mount Etna: constraints imposed by eruptive history and numerical simulations. Scientific Reports, 3(1). https://doi.org/10.1038/srep03493
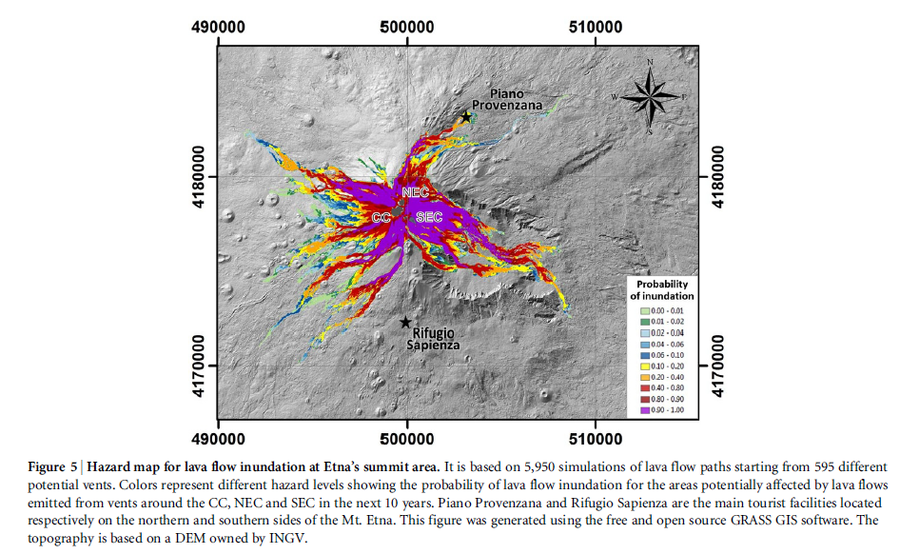
Figure in a journal article
Hazard map for lava flow inundation at Etna’s summit area.
Figure 5 in: Del Negro, C., Cappello, A., Neri, M., Bilotta, G., Hérault, A., & Ganci, G. (2013). Lava flow hazards at Mount Etna: constraints imposed by eruptive history and numerical simulations. Scientific Reports, 3(1). https://doi.org/10.1038/srep03493
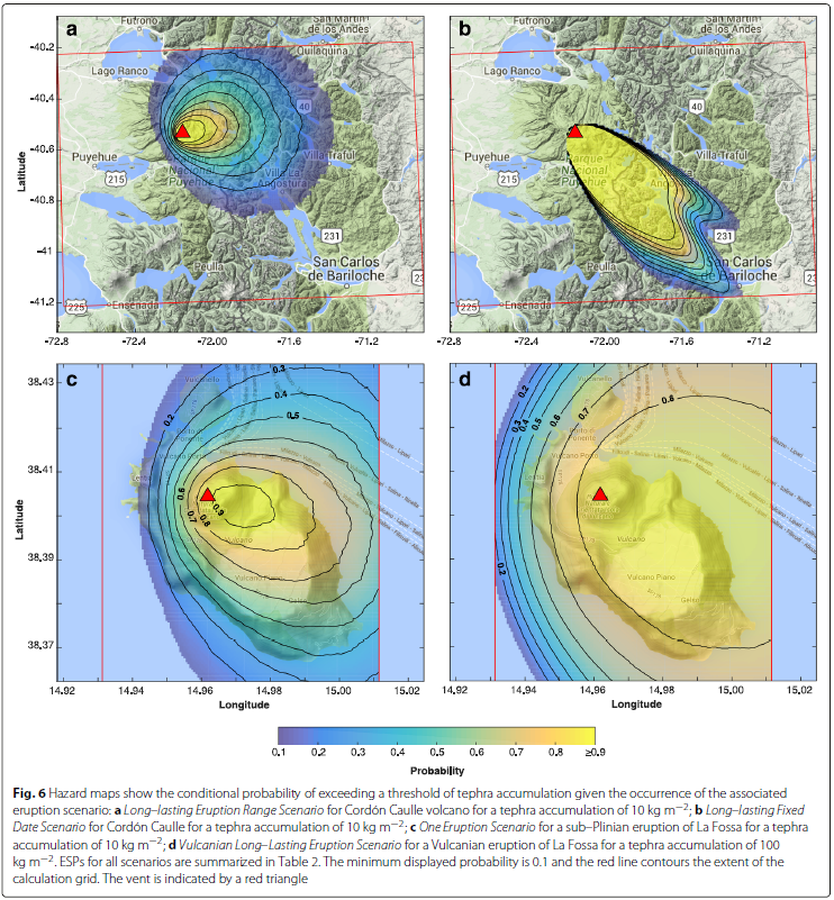
Figure in a journal article
Hazard maps show the conditional probability of exceeding a threshold of tephra accumulation given the occurrence of the associated eruption scenario
Figure 6 in: Biass, S., Bonadonna, C., Connor, L., & Connor, C. (2016). TephraProb: a Matlab package for probabilistic hazard assessments of tephra fallout. Journal of Applied Volcanology, 5(1), 1-16. https://doi.org/10.1186/s13617-016-0050-5
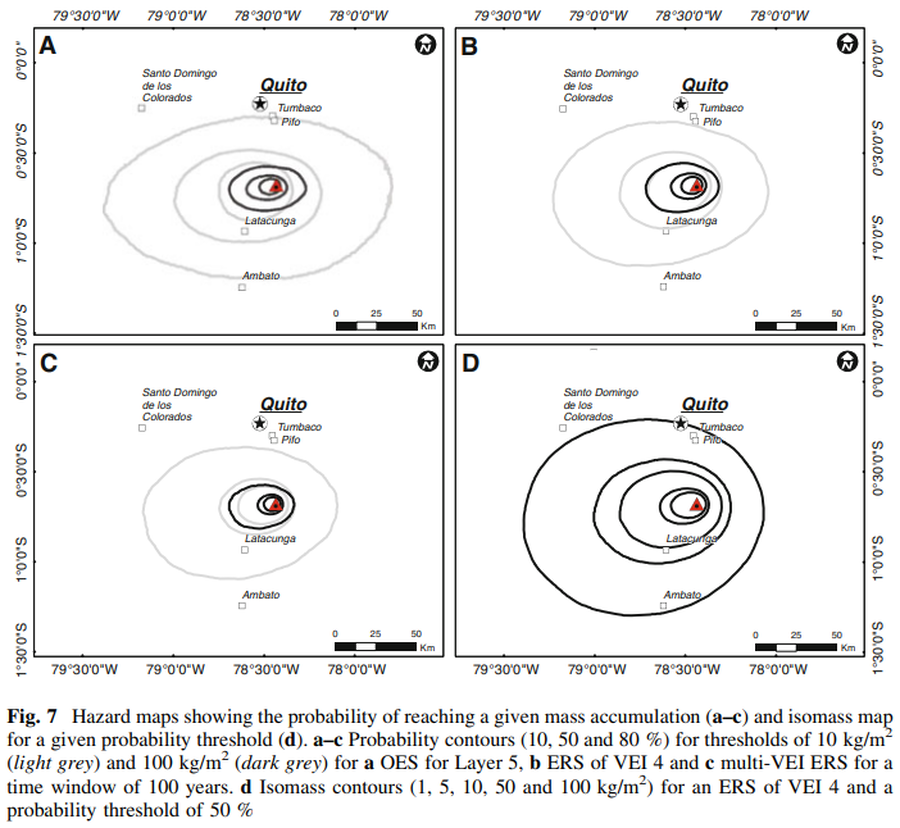
Figure in a journal article
Hazard maps showing the probability of reaching a given mass accumulation (a–c) and isomass map for a given probability threshold (d)
Figure 7 in: Biass, S., & Bonadonna, C. (2013). A fast GIS-based risk assessment for tephra fallout: the example of Cotopaxi volcano, Ecuador. Natural Hazards, 65, 477-495. https://doi.org/10.1007/s11069-012-0378-z
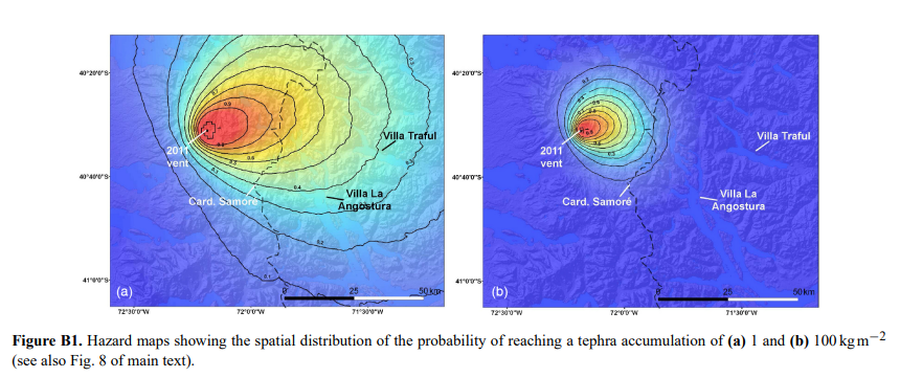
Figure in a journal article
Hazard maps showing the spatial distribution of the probability of reaching a tephra accumulation of (a) 1 and (b) 100 kg m−2
Figure B1 in: Elissondo, M., Baumann, V., Bonadonna, C., Pistolesi, M., Cioni, R., Bertagnini, A., Biass, S., Herrero, J.-C., & Gonzalez, R. (2016). Chronology and impact of the 2011 Cordón Caulle eruption, Chile. Natural Hazards and Earth System Sciences, 16(3), 675-704. https://doi.org/10.5194/nhess-16-675-2016, 2016
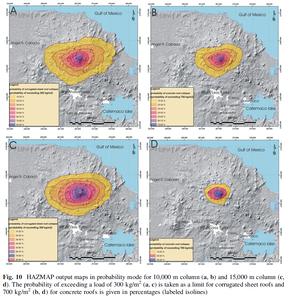
Figure in a journal article
HAZMAP output maps in probability mode for 10,000 m column (a, b) and 15,000 m column (c, d).
Figure 10 in: Sieron, K., Capra, L., & Rodríguez-Elizararrás, S. (2014). Hazard assessment at San Martín volcano based on geological record, numerical modeling, and spatial analysis. Natural hazards, 70(1), 275-297. https://doi.org/10.1007/s11069-013-0807-7