
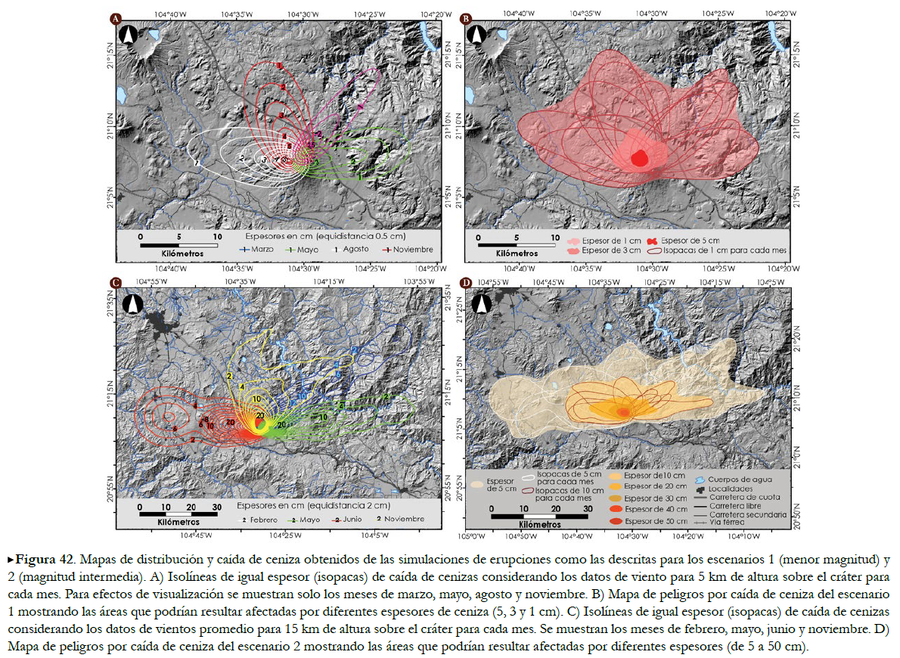
Mapas de distribución y caída de ceniza obtenidos de las simulaciones de erupciones como las descritas para los escenarios 1 (menor magnitud) y 2 (magnitud intermedia).
Maps of distribution and ash fall obtained from the simulations of eruptions such as those described for scenarios 1 (lower magnitude) and 2 (intermediate magnitude)
Ceboruco, Mexico, 2019
Figure 42 in: Ferrés López, D., Sieron, K., González Zuccolotto, K., Constantinescu, R., Agustín Flores, J., Siebe Grabach, C., Capra Pedol, L., Connor, L., & Connor, C.B. (2019). Memoria técnica del mapa de peligros del volcán Ceboruco (Nayarit). Monografías del Instituto de Geofísica, 24.
This map was produced by an official agency, but may not be the most recent, most complete, or main operational map.
For the current operational hazard map, please consult the proper institutional authorities.
Click on image for full-size map. If link seems broken, try the archived version.
Ferrés Lopez, D., Sieron, K., González Zuccolotto, K., Constantinescu, R., Agustín Flores, J., Siebe, C., Capra, L., Connor, L., & Connor, C.B. (2019). Memoria técnica del mapa de peligros del volcán Ceboruco (Nayarit). Monografías del Instituto de Geofísica, 24. Map Set
https://www.geofisica.unam.mx/recursos/docs/editorial/IGEF_monografias_24.pdf
Other Maps In Set: