
Advanced Search for Maps
Showing 1-10 of 20
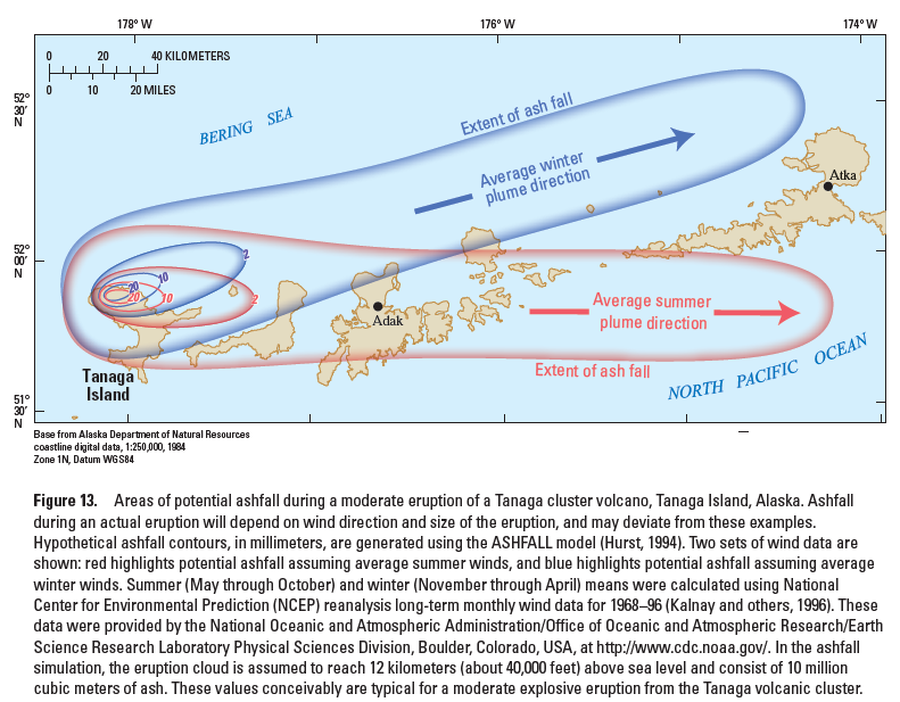
Official, Figure in hazard assessment
Areas of potential ashfall during a moderate eruption of a Tanaga cluster volcano, Tanaga Island, Alaska
Figure 13 in: Coombs, M.L., McGimsey, R.G. & Browne, B.L. (2007). Preliminary volcano-hazard assessment for the Tanaga volcanic cluster, Tanaga Island, Alaska. U.S. Geological Survey, Scientific Investigations Report 2007-5094, 41 p., 1 plate. https://doi.org/10.3133/sir20075094
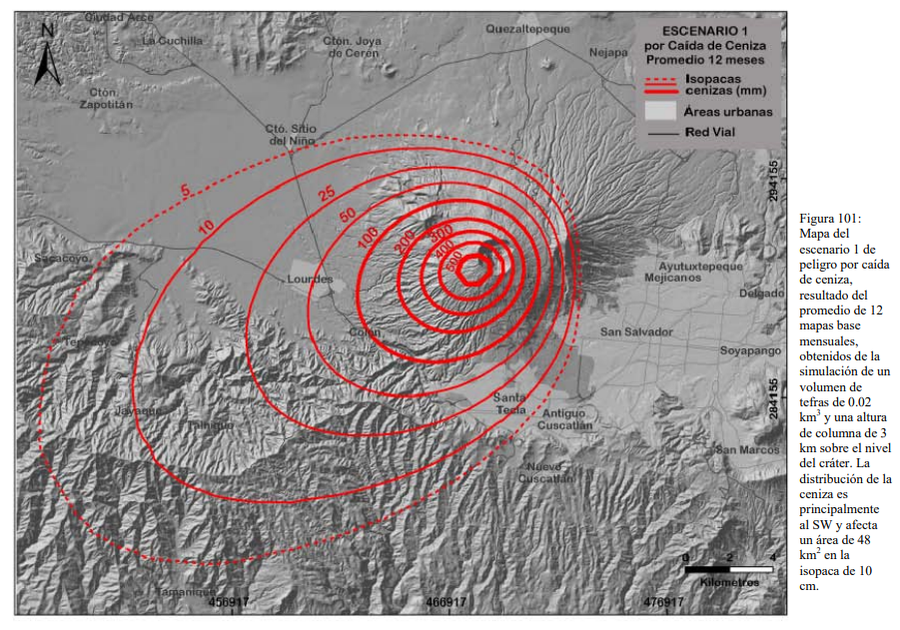
Figure in a thesis or dissertation
Escenario 1 por Caida de Ceniza Promedio 12 Meses
(Scenario 1 for Average Ash Fall 12 Months)
Figure 101 in: Ferrés López, M.D. (2014). Estratigrafía, Geología y Evaluación de Peligros Volcánicos del Complejo Volcánico de San Salvador (El Salvador). Doctoral Thesis, Universidad Autónoma de México, México.
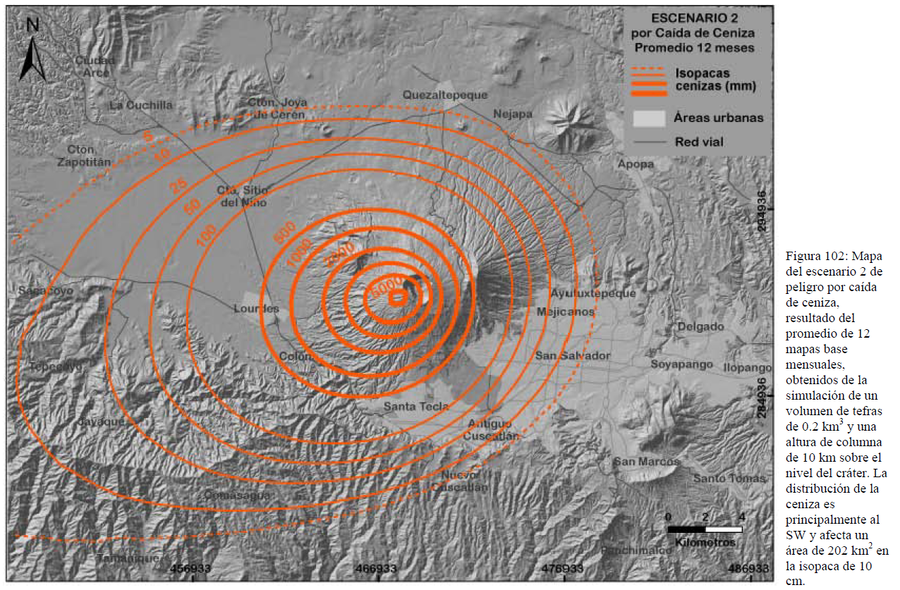
Figure in a thesis or dissertation
Escenario 2 por Caida de Ceniza Promedio 12 Meses
(Scenario 2 for Average Ash Fall 12 Months)
Figure 102 in: Ferrés López, M.D. (2014). Estratigrafía, Geología y Evaluación de Peligros Volcánicos del Complejo Volcánico de San Salvador (El Salvador). Doctoral Thesis, Universidad Autónoma de México, México.
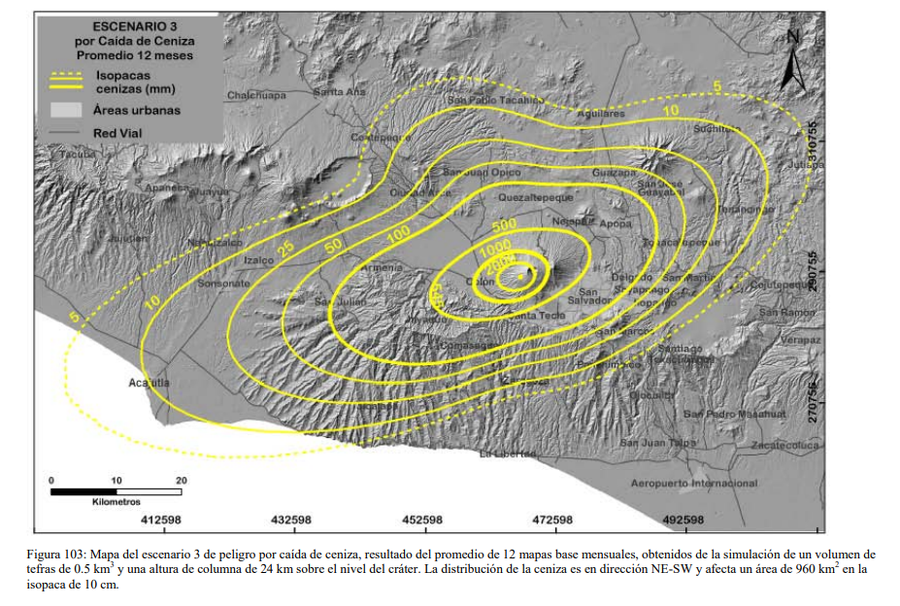
Figure in a thesis or dissertation
Escenario 3 por Caida de Ceniza Promedio 12 Meses
(Scenario 3 for Average Ash Fall 12 Months)
Figure 103 in: Ferrés López, M.D. (2014). Estratigrafía, Geología y Evaluación de Peligros Volcánicos del Complejo Volcánico de San Salvador (El Salvador). Doctoral Thesis, Universidad Autónoma de México, México.
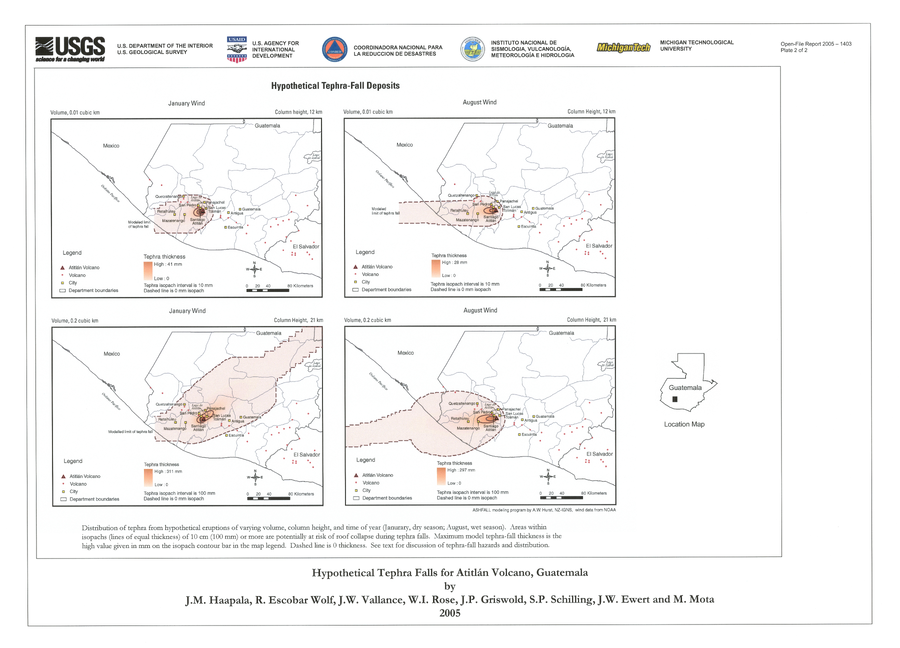
Official (foreign agency), Insert/poster-size map with accompanying report
Hypothetical Tephra-fall Deposits
Plate 2 in: Haapala, J. M., Escobar Wolf, R., Vallance, J. W., Rose, W. I., Griswold, J. P., Schilling, S. P., Ewert, J.W., & Mota, M. (2005). Volcanic hazards at Atitlan volcano, Guatemala. U.S. Geological Survey, Open-File Report, 1403. https://doi.org/10.3133/ofr20051403
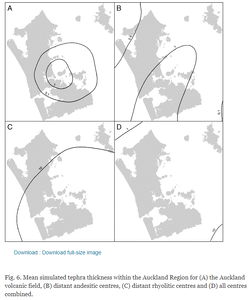
Figure in a journal article
Mean simulated tephra thickness within the Auckland Region
Figure 6 in: Magill, C. R., Hurst, A. W., Hunter, L. J., & Blong, R. J. (2006). Probabilistic tephra fall simulation for the Auckland Region, New Zealand. Journal of volcanology and geothermal research, 153(3-4), 370-386. https://doi.org/10.1016/j.jvolgeores.2005.12.002
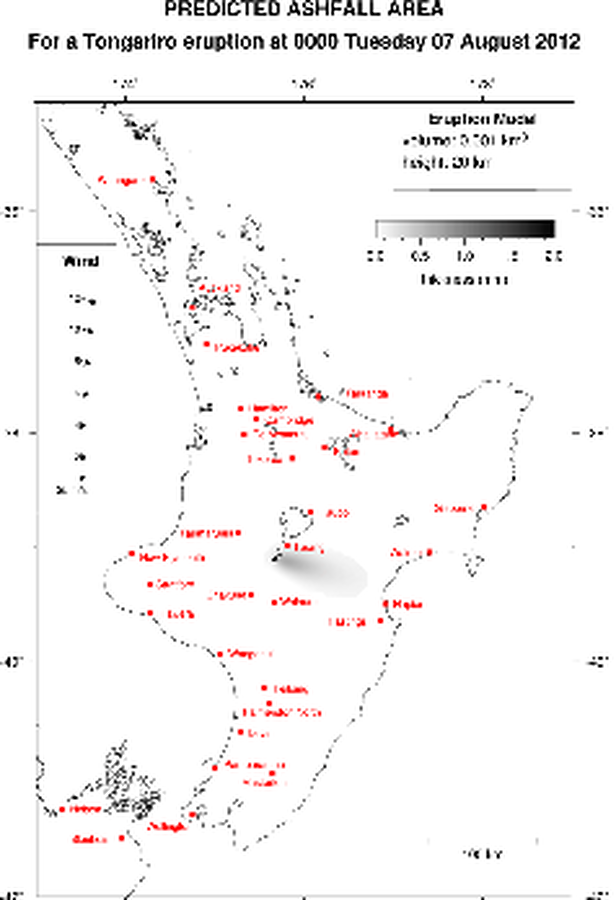
Official, Map in an information statement
Predicted Ashfall Area for a Tongariro eruption at 0000 Tuesday 07 August 2012
GNS Science. (2012). Volcanic Alert Bulletin TON2012-06.
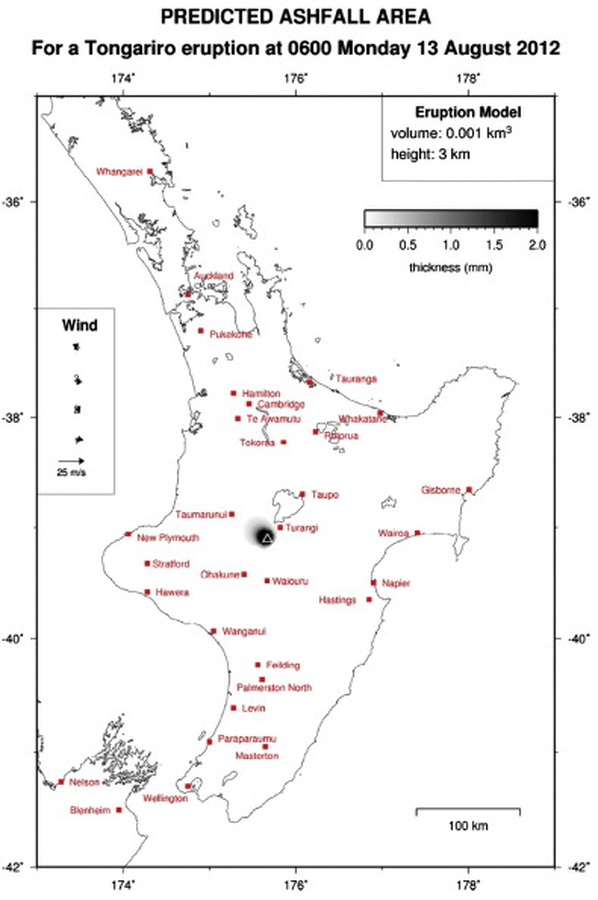
Official, Map in an information statement
Predicted Ashfall Area for a Tongariro eruption at 0600 Monday 13 August 2012
GNS Science. (2012). Volcanic Alert Bulletin TON2012-17. (Reprinted in: Leonard, G. S., Stewart, C., Wilson, T. M., Procter, J. N., Scott, B. J., Keys, H. J., Jolly, G.E., Wardman, J.B., Cronin. S.J. & McBride, S. K. (2014). Integrating multidisciplinary science, modelling and impact data into evolving, syn-event volcanic hazard mapping and communication: a case study from the 2012 Tongariro eruption crisis, New Zealand. Journal of Volcanology and Geothermal Research, 286, p. 208-232. https://doi.org/10.1016/j.jvolgeores.2014.08.018)
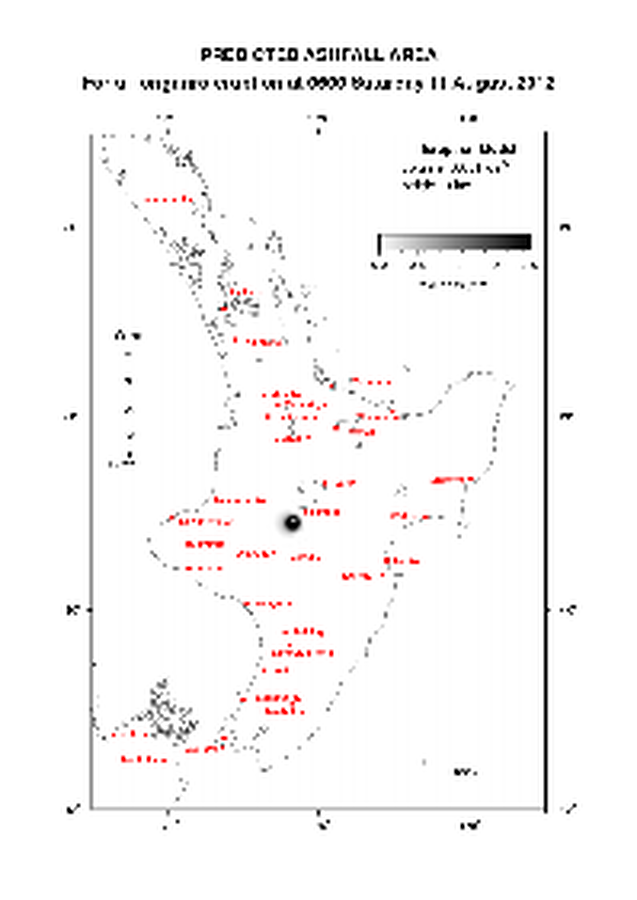
Official, Map in an information statement
Predicted Ashfall Area for a Tongariro eruption at 0600 Saturday 11 August 2012
GNS Science. (2012). Volcanic Alert Bulletin TON2012-14.
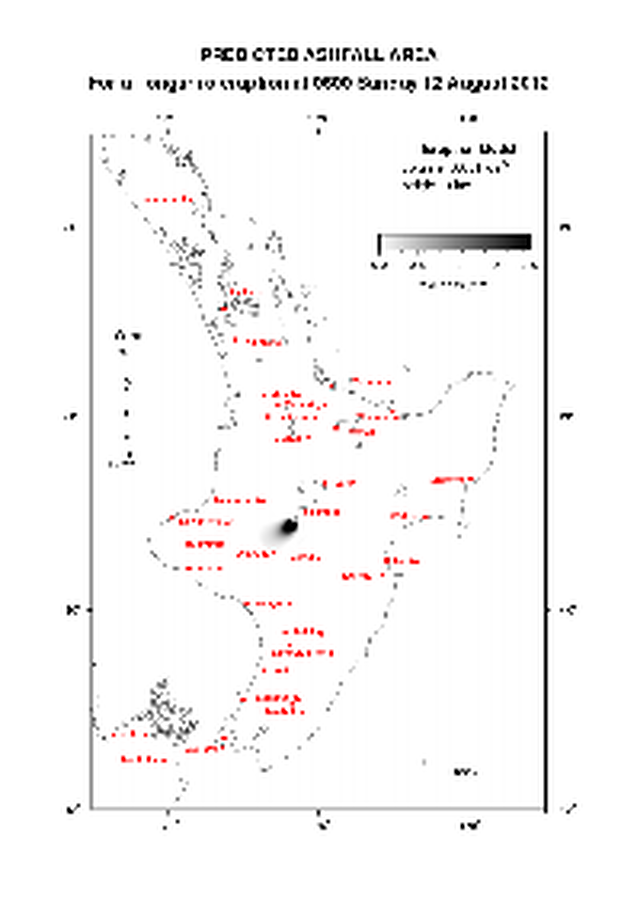
Official, Map in an information statement
Predicted Ashfall Area for a Tongariro eruption at 0600 Sunday 12 August 2012
GNS Science. (2012). Volcanic Alert Bulletin TON2012-16.
Page: 1 2