
Advanced Search for Maps
Showing 1781-1790 of 2217

Official, Figure in hazard assessment
Tephra-hazard zones for future tephra eruptions of Glacier Peak.
Figure 20 in: Beget, J.E. (1982). Postglacial Volcanic Deposits at Glacier Peak, Washington, and Potential Hazards from Future Eruptions. U.S. Geological Survey, Open-File Report 82-830, 81 p. https://doi.org/10.3133/ofr82830
Official, Figure in a journal article
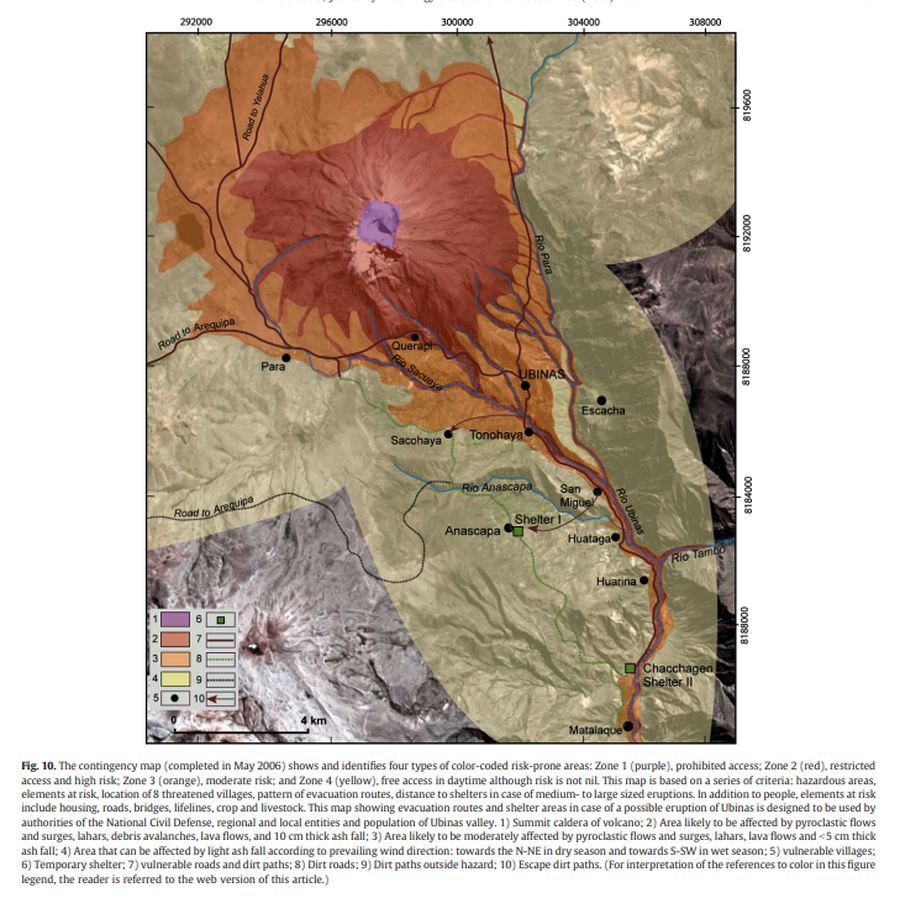
The contingency map (completed in May 2006) shows and identifies four types of color-coded risk-prone areas
Figure 10 in: Rivera, M., Thouret, J. C., Mariño, J., Berolatti, R., & Fuentes, J. (2010). Characteristics and management of the 2006–2008 volcanic crisis at the Ubinas volcano (Peru). Journal of Volcanology and Geothermal Research, 198(1-2), p. 19-34. https://doi.org/10.1016/j.jvolgeores.2010.07.020
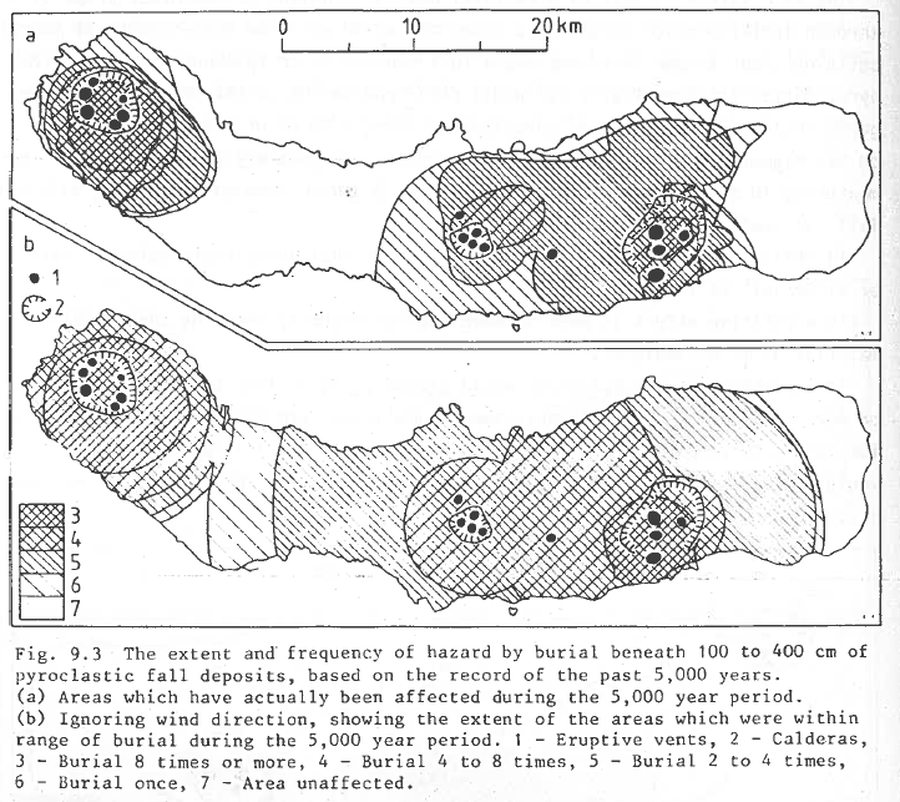
Figure in a journal article
The extent and frequency of hazard from burial beneath 100 to 400 cm of pyroclastic fall deposits, based on the record of the past 5,000 years
Figure 9.3 in: Booth, B., Croasdale, R., & Walker, G.L. (1983). Volcanic hazard on Sao Miguel, Azores. In: Tazieff, H. & Sabroux, J.C. (eds.). Forecasting Volcanic Events. Elsevier, Amsterdam. p. 99-109.
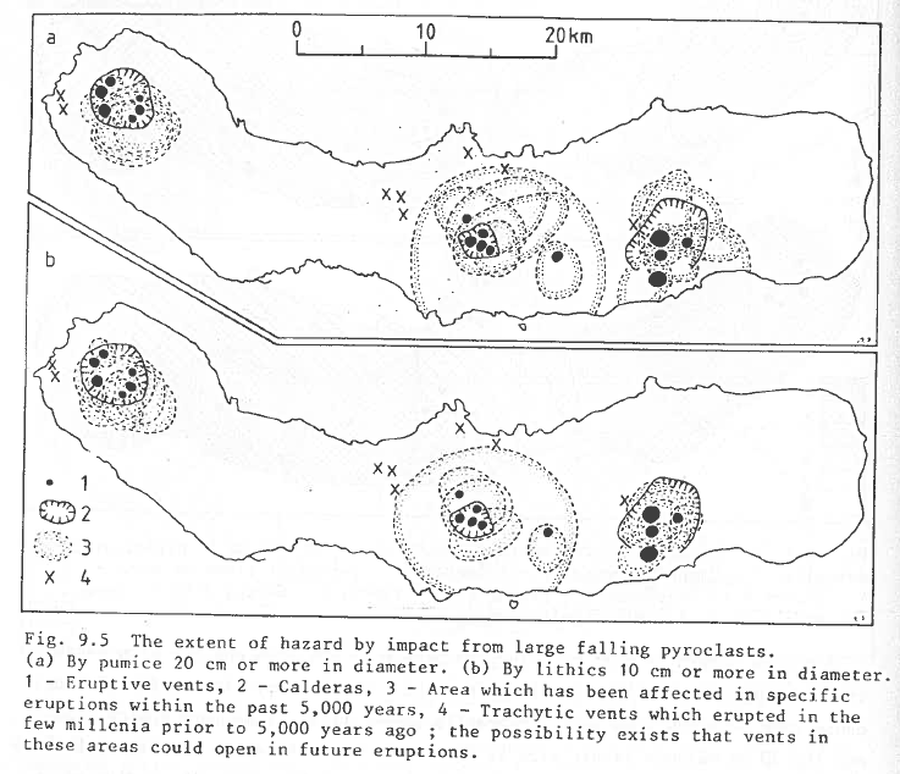
Figure in a journal article
The extent of hazard by impact from large falling pyroclasts
Figure 9.5 in: Booth, B., Croasdale, R., & Walker, G.L. (1983). Volcanic hazard on Sao Miguel, Azores. In: Tazieff, H. & Sabroux, J.C. (eds.). Forecasting Volcanic Events. Elsevier, Amsterdam. p. 99-109.
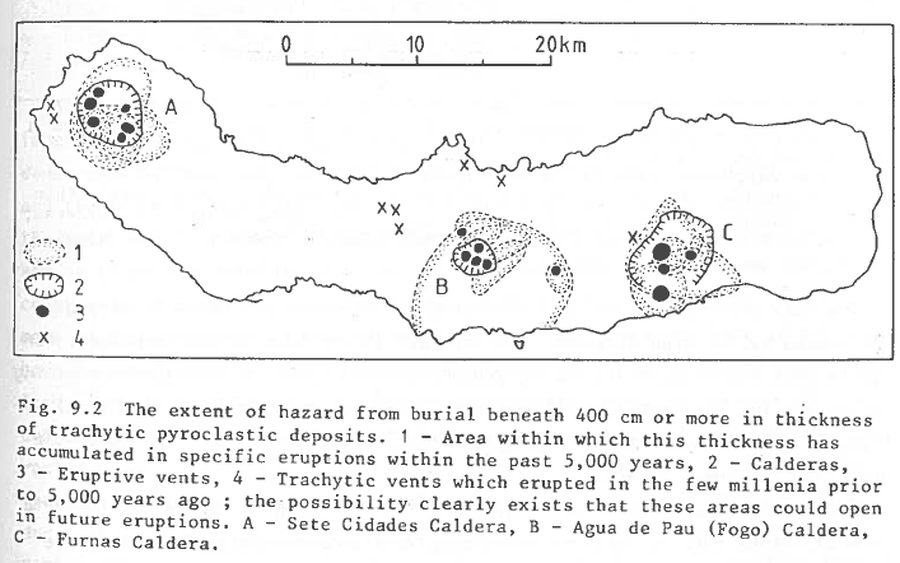
Figure in a journal article
The extent of hazard from burial beneath 400 cm or more in thickness of trachytic pyroclastic deposits
Figure 9.2 in: Booth, B., Croasdale, R., & Walker, G.L. (1983). Volcanic hazard on Sao Miguel, Azores. In: Tazieff, H. & Sabroux, J.C. (eds.). Forecasting Volcanic Events. Elsevier, Amsterdam. p. 99-109.

Figure in a journal article
The hazard map for lava flows at Ceboruco volcano
Figure 5 in: Sieron, K., Ferrés, D., Siebe, C., Constantinescu, R., Capra, L., Connor, C., Connor, L., Groppelli, G. & Zuccolotto, K.G. (2019). Ceboruco hazard map: part II—modeling volcanic phenomena and construction of the general hazard map. Natural Hazards, 96(2), p. 893-933. https://doi.org/10.1007/s11069-019-03577-5
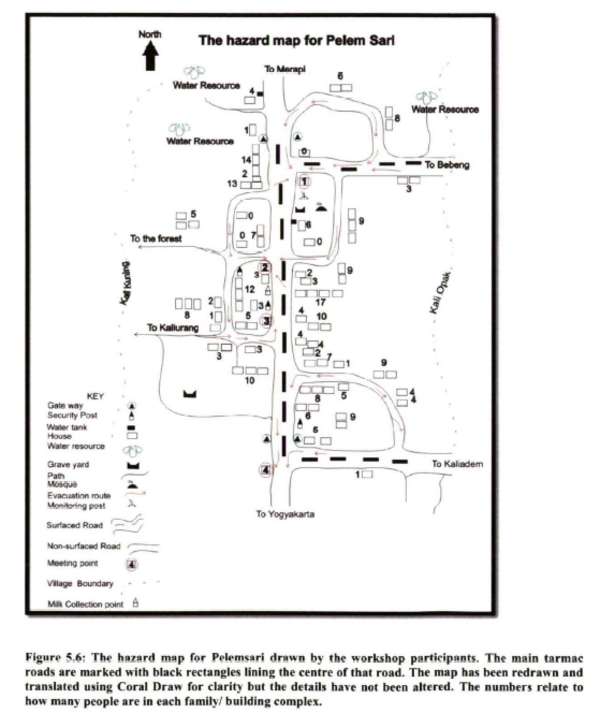
Figure in a thesis or dissertation
The hazard map for Pelem Sari
Figure 5.6 in: Donovan, K.H.M. (2010). Cultural responses to volcanic hazards on Mt Merapi, Indonesia. University of Plymouth, PhD Dissertation.
Official, Map in a booklet, long fact-sheet, or handbook
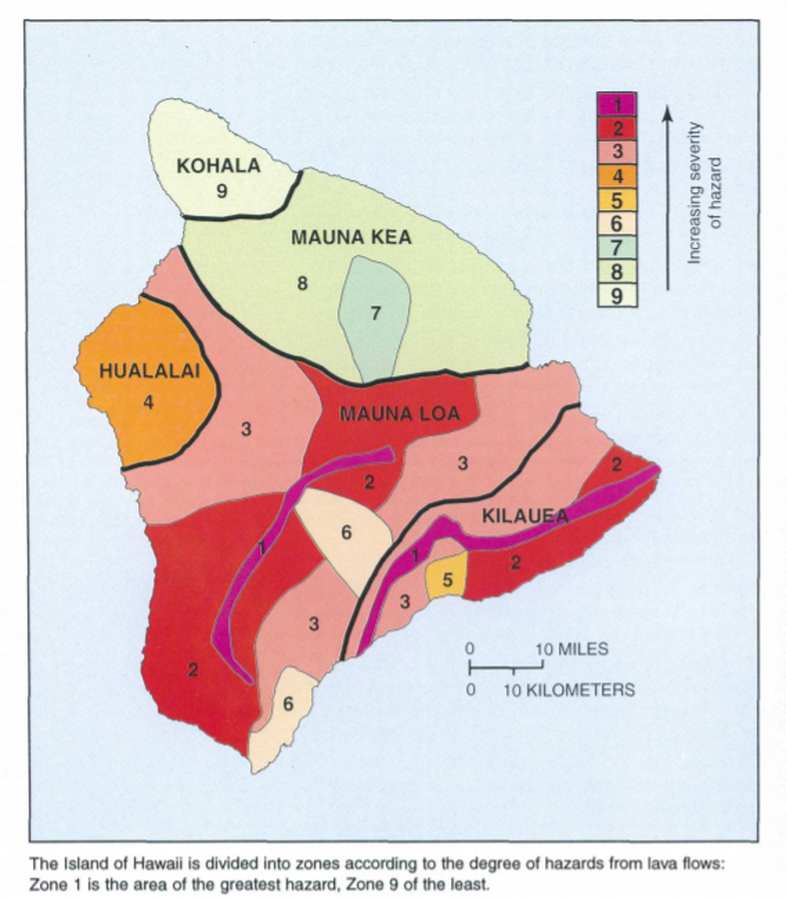
The Island of Hawaii is divided into zones according to the degree of hazards from lava flows
Page 22 in: U.S. Geological Survey (USGS). (1997). Volcanic and Seismic Hazards on the Island of Hawaii. U.S. Geological Survey, Unumbered Series, 48 p. https://doi.org/10.3133/7000036 (Simplified from: Wright 1992)

Official, Figure in a journal article
The isolines show the arrival time in hours required for the ash concentration (at FL050) to exceed a threshold of 2 mg m−3 with an exceedance probability of 5% between 0 and 48 h after the eruption
Figure 8 in: Titos, M., Martínez Montesinos, B., Barsotti, S., Sandri, L., Folch, A., Mingari, L., Macedonio, G. & Costa, A. (2022). Long-term hazard assessment of explosive eruptions at Jan Mayen (Norway) and implications for air traffic in the North Atlantic. Natural Hazards and Earth System Sciences, 22(1), 139-163. https://doi.org/10.5194/nhess-22-139-2022
Official, Figure in a conference presentation
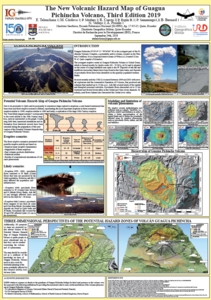
The New Volcanic Hazard Map of Guagua Pichincha Volcano, Third Edition 2019
Telenchana, E., Córdova, M., Mothes, P., Espín, P., Samaniego, P., Bernard, B., Vallejo, S., & Proaño A. (2019). The new potential volcanic hazard map of Guagua Pichincha Volcano, Third Edition 2019. 8th International Symposium on Andean Geodynamics (ISAG).