
Advanced Search for Maps
Showing 1801-1810 of 2217
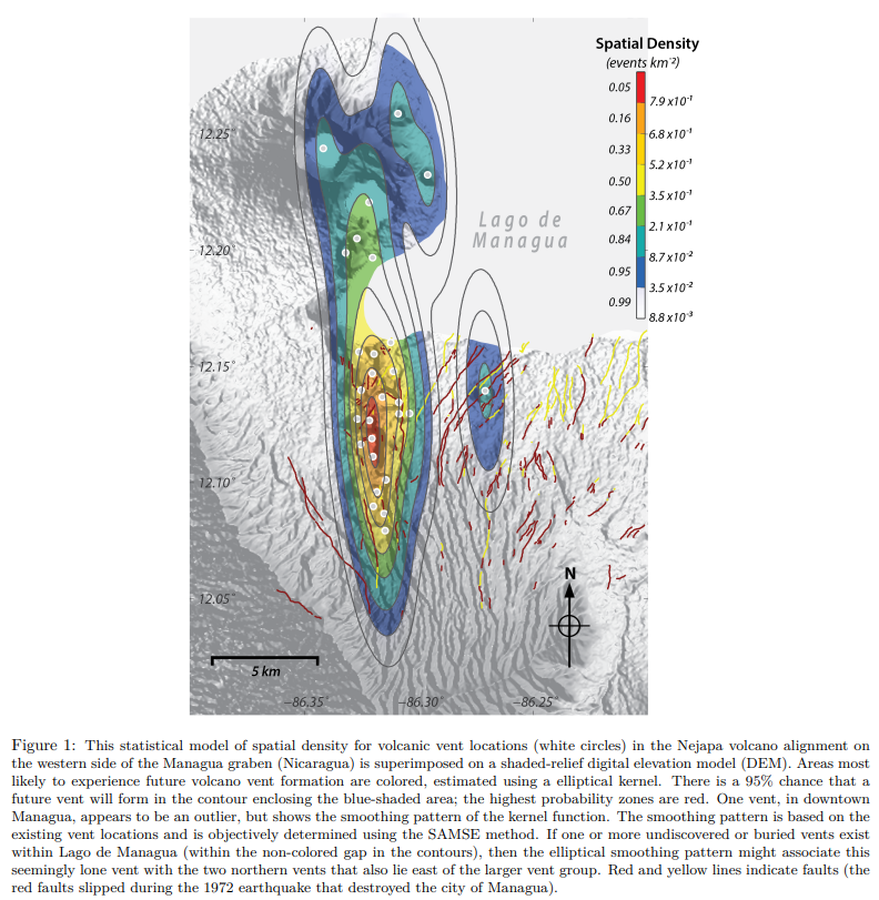
Figure in a journal article
This statistical model of spatial density for volcanic vent locations (white circles) in the Nejapa volcano alignment on the western side of the Managua graben (Nicaragua) is superimposed on a shaded-relief digital elevation model (DEM)
Figure 1 in: Connor, C. B., Connor, L. J., Germa, A., Richardson, J. A., Bebbington, M. S., Gallant, E., & Saballos, A. (2019). How to use kernel density estimation as a diagnostic and forecasting tool for distributed volcanic vents. Statistics in Volcanology, 4 (3). p. 1-25. http://dx.doi.org/10.5038/2163-338X.4.3
Official, Figure in hazard assessment
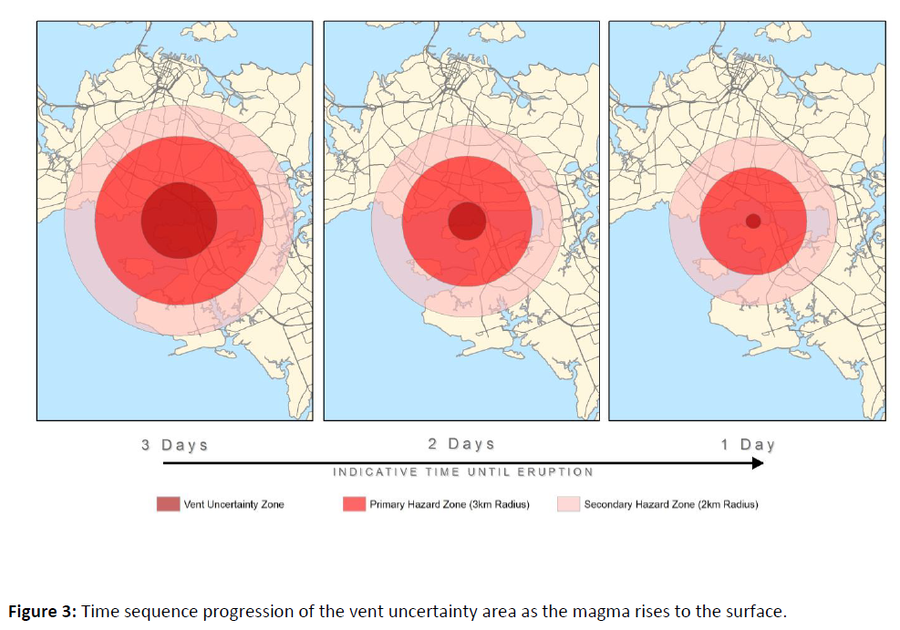
Time sequence progression of the vent uncertainty area as the magma rises to the surface
Figure 3 in: Auckland Council (2015). Auckland Volcanic Field Contingency Plan March 2015. Civil Defence and Emergency Management. Auckland. 50 p.
Official, Insert/poster-size map with accompanying report
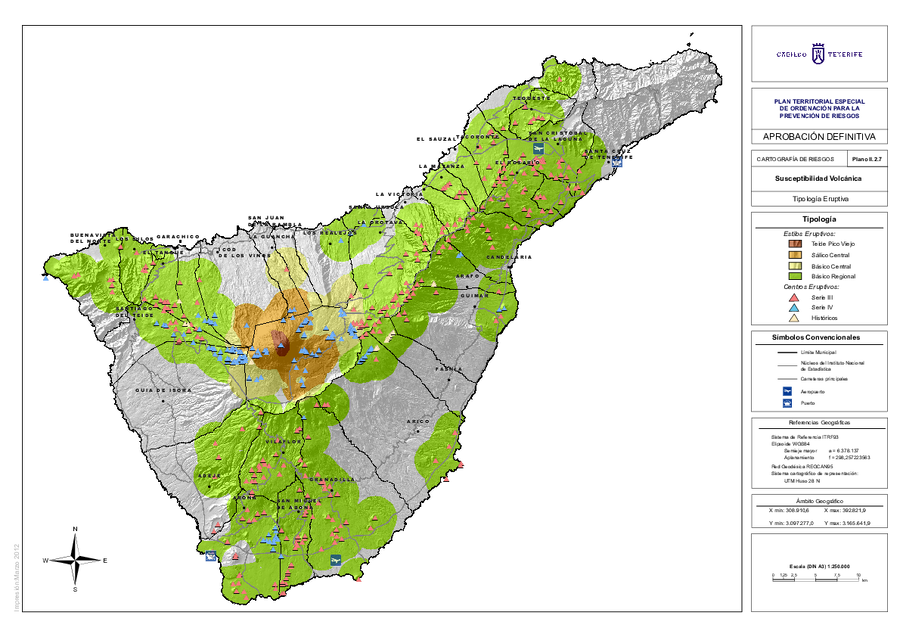
Tipología Eruptiva
(Eruptive Type)
Map II.2.7 in: Cabildo Tenerife. (2012). Plan Territorial Especial de Ordenación para la Prevención de Riesgos. Documento Cartográfico (Planos de Información).
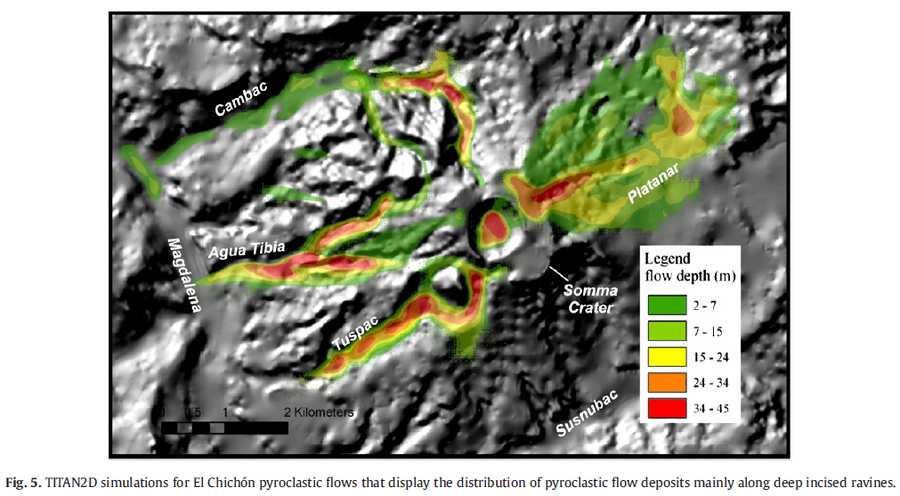
Figure in a journal article
TITAN2D simulations for El Chichón pyroclastic flows that display the distribution of pyroclastic flow deposits mainly along deep incised ravines
Figure 5 in: Macías, J. L., Capra, L., Arce, J. L., Espíndola, J. M., García-Palomo, A., & Sheridan, M. F. (2008). Hazard map of El Chichón volcano, Chiapas, México: Constraints posed by eruptive history and computer simulations. Journal of Volcanology and Geothermal Research, 175(4), 444-458. https://doi.org/10.1016/j.jvolgeores.2008.02.023
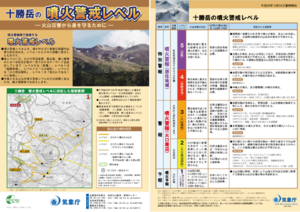
Official, Flyer, brochure, short fact-sheet, or handout
Tokachidake Volcanic Alert Levels
Japan Meteorological Agency. (2020). Tokachidake Volcanic Alert Levels. Volcano Monitoring and Warning Center, Volcano Division, Earthquake and Volcano Department.
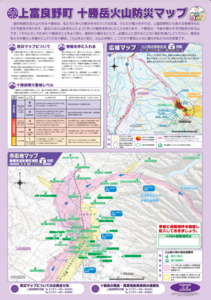
Official, Map sheet or poster
Tokachidake Volcano Disaster Prevention Map for Kamifurano
Kamifurano Town. (2016). Tokachidake Volcano Disaster Prevention Map for Kamifurano.
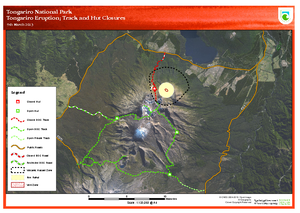
Official, Sign or billboard
Tongariro Eruption Track and Hut Closures 9th March 2013
Department of Conservation. (2013). Tongariro Eruption; Track and Hut Closures. 9th March 2013.
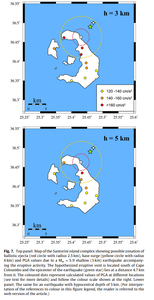
Figure in a journal article
Top panel: Map of the Santorini island complex showing possible zonation of ballistic ejecta (red circle with radius 2.5 km), base surge (yellow circle with radius 6 km) and PGA values due to a Mw =5.9 shallow (3 km) earthquake accompanying the eruptive activity...Lower panel: The same for an earthquake with hypocentral depth of 5 km
Figure 7 in: Konstantinou, K.I. & Yeh, T.Y. (2012). Stress field around the Coloumbo magma chamber, southern Aegean: Its significance for assessing volcanic and seismic hazard in Santorini. Journal of Geodynamics, 54, 13-20. https://doi.org/10.1016/j.jog.2011.09.003
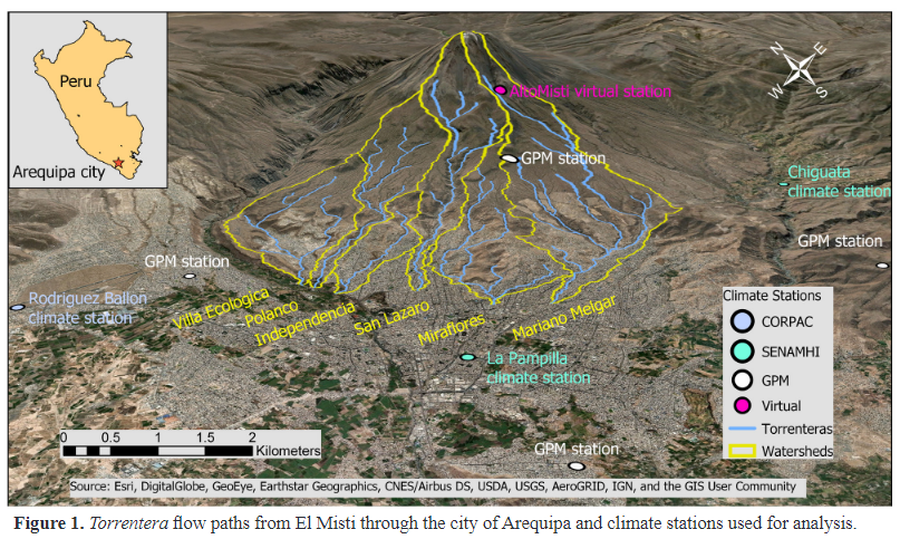
Figure in a journal article
Torrentera flow paths from El Misti through the city of Arequipa and climate stations used for analysis
Figure 1 in: Mazer, K. E., Tomasek, A. A., Daneshvar, F., Bowling, L. C., Frankenberger, J. R., McMillan, S. K., Novoa, H.M., & Zeballos‐Velarde, C. (2021). Integrated hydrologic and hydraulic analysis of torrential flood hazard in Arequipa, Peru. Journal of Contemporary Water Research & Education, 171(1), 93-110. https://doi.org/10.1111/j.1936-704X.2020.3347.x

Official, Map in a booklet, long fact-sheet, or handbook
Traffic regulations and evacuation routes (When volcanic alert level 5 [5-1] (evacuation) is announced)
Page 7-8 in: Hakodate City. (2016). Disaster Prevention Handbook of Esan. 12 p.