
Advanced Search for Maps
Showing 41-50 of 252
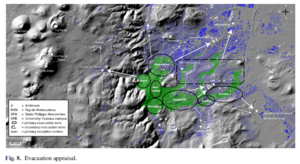
Figure in a journal article
Evacuation appraisal
Figure 8 in: Latutrie, B., Andredakis, I., De Groeve, T., Harris, A. J. L., Langlois, E., de Vries, B. V. W., Saubin, E., Bilotta, G., Cappello, A., Crisci, G.M., D'ambrosio, D., Del Negro, C., Favalli, M., Fujita, E., Iovine, G., Kelfoun, K., Rongo, R., Spataro, W., Tarquini, S., Coppola, D., Ganci, G., Marchese, F., Pergola, N., & Tramutoli, V. (2016). Testing a geographical information system for damage and evacuation assessment during an effusive volcanic crisis. In: Harris, A.J.L., De Groeve, T., & Carn, S.A. (Eds.) Detecting, Modelling and Responding to Effusive Eruptions. Geological Society, London, Special Publications, 426(1), p. 649-672. https://doi.org/10.1144/SP426.19
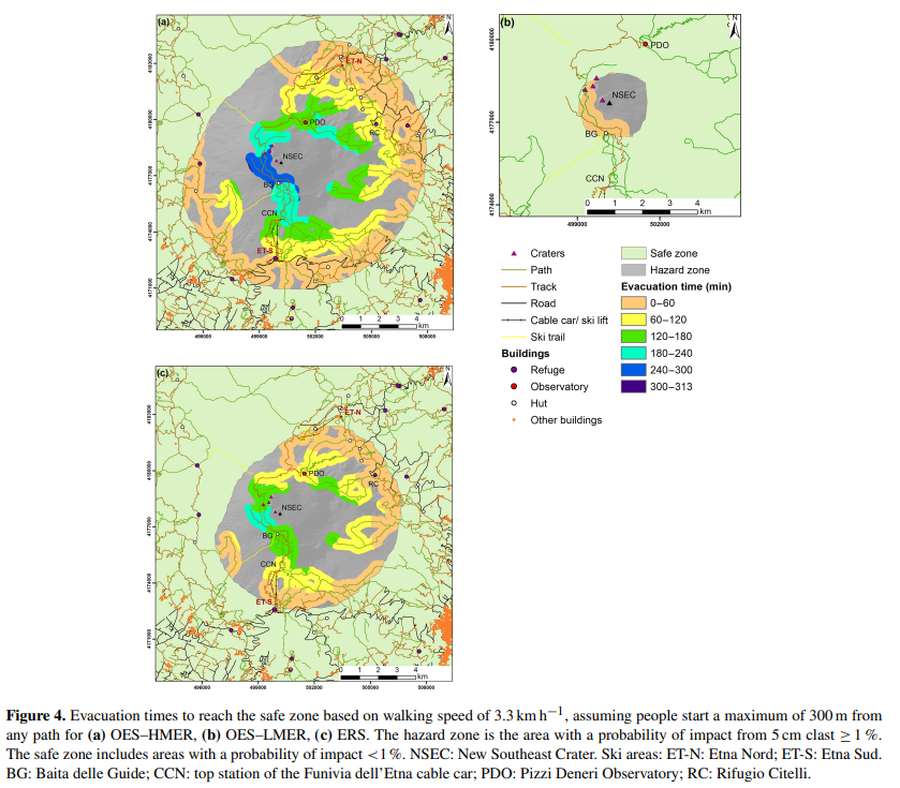
Figure in a journal article
Evacuation times to reach the safe zone based on walking speed of 3.3 km h^−1
Figure 4 in: Osman, S., Rossi, E., Bonadonna, C., Frischknecht, C., Andronico, D., Cioni, R., & Scollo, S. (2019). Exposure-based risk assessment and emergency management associated with the fallout of large clasts at Mount Etna. Natural Hazards and Earth System Sciences, 19(3), 589-610. https://doi.org/10.5194/nhess-19-589-2019
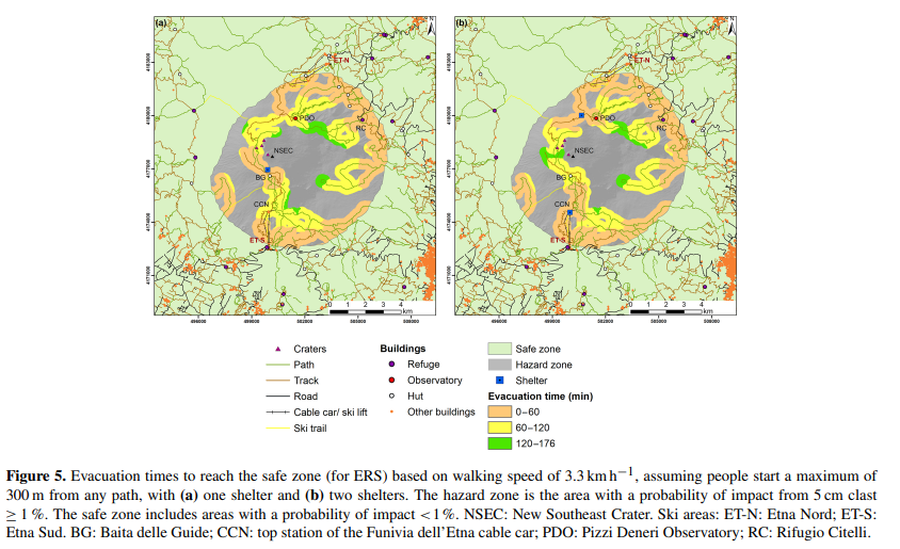
Figure in a journal article
Evacuation times to reach the safe zone based on walking speed of 3.3 km h^−1, assuming people start a maximum of 300 m from any path, with (a) one shelter and (b) two shelters
Figure 5 in: Osman, S., Rossi, E., Bonadonna, C., Frischknecht, C., Andronico, D., Cioni, R., & Scollo, S. (2019). Exposure-based risk assessment and emergency management associated with the fallout of large clasts at Mount Etna. Natural Hazards and Earth System Sciences, 19(3), 589-610. https://doi.org/10.5194/nhess-19-589-2019
Official, Figure in hazard assessment
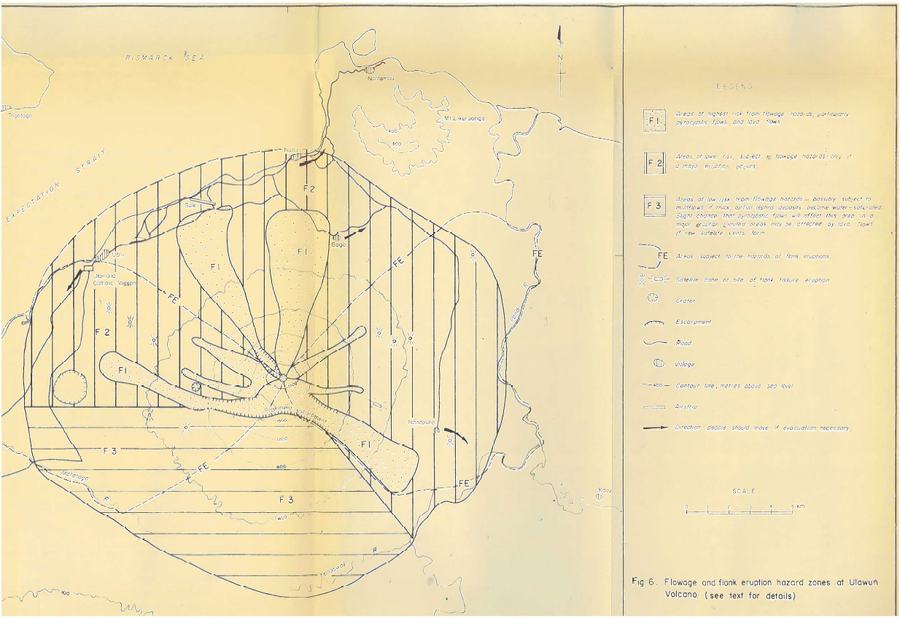
Flowage and flank eruption hazard zones at Ulawun Volcano
Figure 6 in: McKee, C.O. (1983). Volcanic hazards at Uluwan volcano. Geological Survey of Papua New Guinea, Report 83/13, 1:100,000
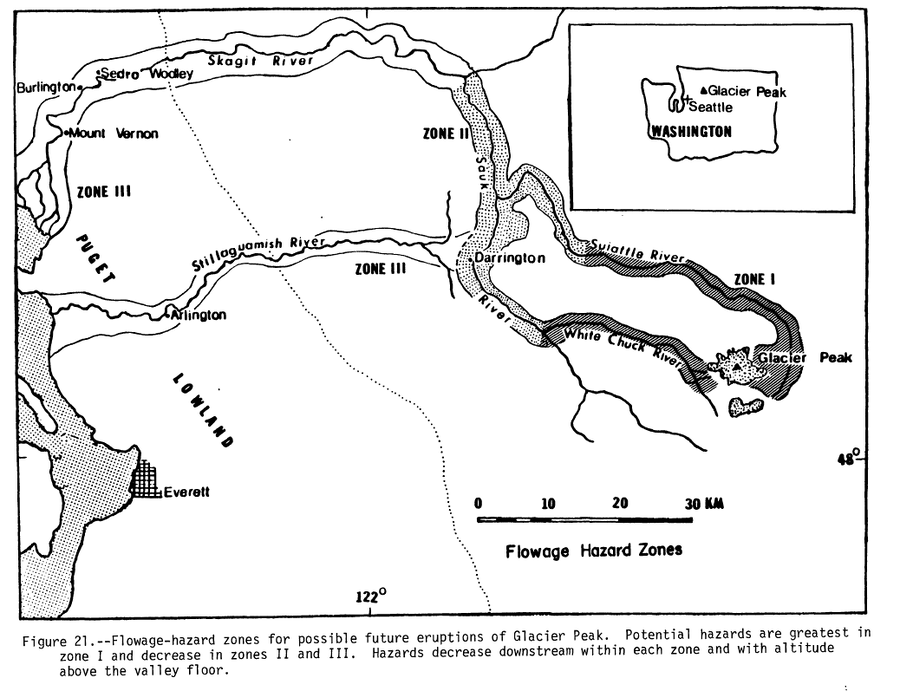
Official, Figure in hazard assessment
Flowage Hazard Zones
Figure 21 in: Beget, J.E. (1982). Postglacial Volcanic Deposits at Glacier Peak, Washington, and Potential Hazards from Future Eruptions. U.S. Geological Survey, Open-File Report 82-830, 81 p. https://doi.org/10.3133/ofr82830
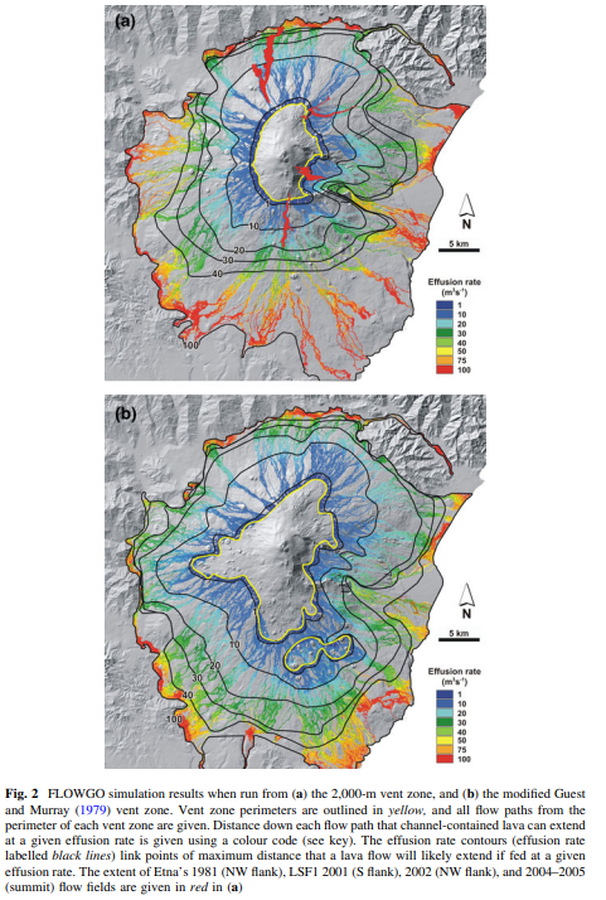
Figure in a journal article
FLOWGO simulation results when run from the 2,000-m vent zone, and the modified Guest and Murray (1979) vent zone.
Figure 2 in: Harris, A. J., Favalli, M., Wright, R., & Garbeil, H. (2011). Hazard assessment at Mount Etna using a hybrid lava flow inundation model and satellite-based land classification. Natural Hazards, 58(3), 1001-1027. https://doi.org/10.1007/s11069-010-9709-0
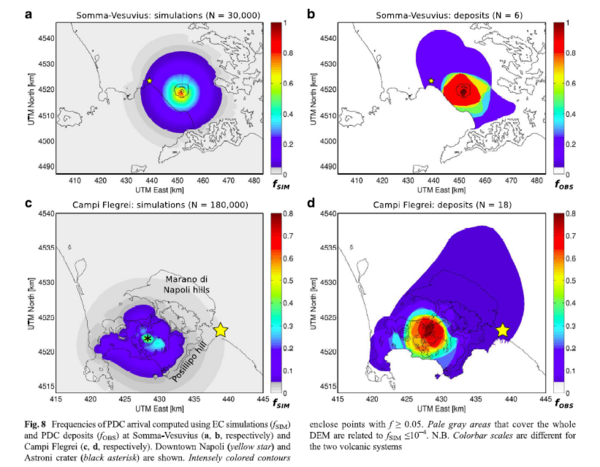
Figure in a journal article
Frequencies of PDC arrival computed using EC simulations and PDC deposits at Somma-Vesuvius and Campi Flegrei
Figure 8c-d in: Tierz, P., Sandri, L., Costa, A., Zaccarelli, L., Di Vito, M. A., Sulpizio, R., & Marzocchi, W. (2016). Suitability of energy cone for probabilistic volcanic hazard assessment: validation tests at Somma-Vesuvius and Campi Flegrei (Italy). Bulletin of Volcanology, 78(11). https://doi.org/10.1007/s00445-016-1073-9
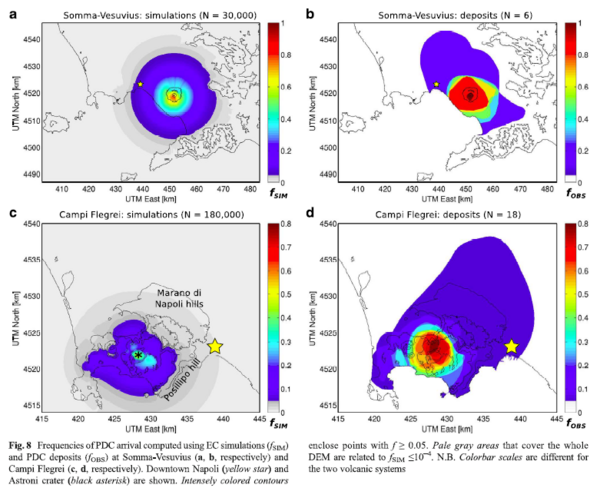
Figure in a journal article
Frequencies of PDC arrival computed using EC simulations and PDC deposits at Somma-Vesuvius and Campi Flegrei
Figure 8a-b in: Tierz, P., Sandri, L., Costa, A., Zaccarelli, L., Di Vito, M. A., Sulpizio, R., & Marzocchi, W. (2016). Suitability of energy cone for probabilistic volcanic hazard assessment: validation tests at Somma-Vesuvius and Campi Flegrei (Italy). Bulletin of Volcanology, 78(11). https://doi.org/10.1007/s00445-016-1073-9
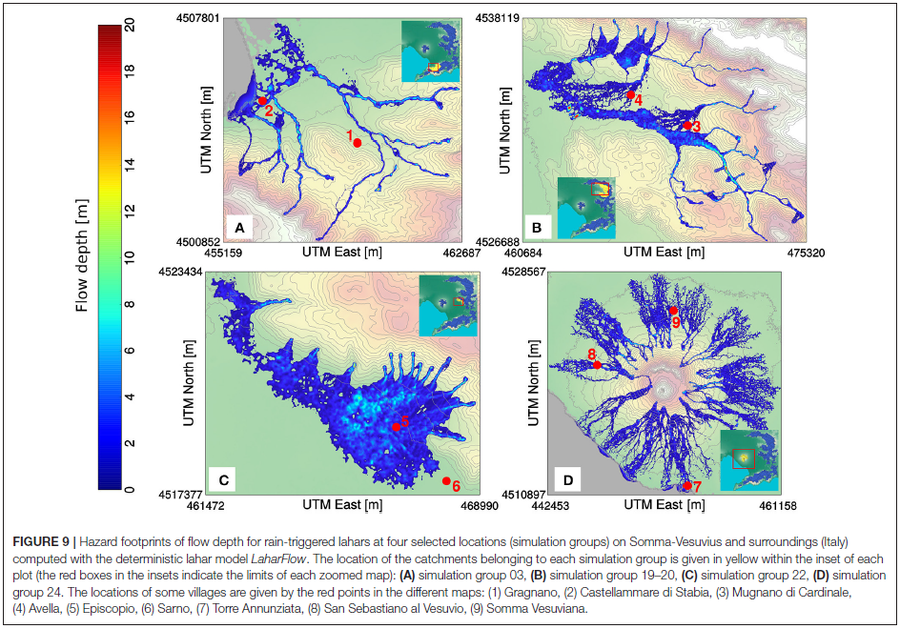
Figure in a journal article
Hazard footprints of flow depth for rain-triggered lahars at four selected locations (simulation groups) on Somma-Vesuvius and surroundings (Italy) computed with the deterministic lahar model LaharFlow
Figure 9 in: Tierz, P., Woodhouse, M.J., Phillips, J.C., Sandri, L., Selva, J., Marzocchi, W., & Odbert, H.M. (2017). A framework for probabilistic multi-hazard assessment of rain-triggered lahars using Bayesian belief networks. Frontiers in Earth Science, 5 (73). https://doi.org/10.3389/feart.2017.00073
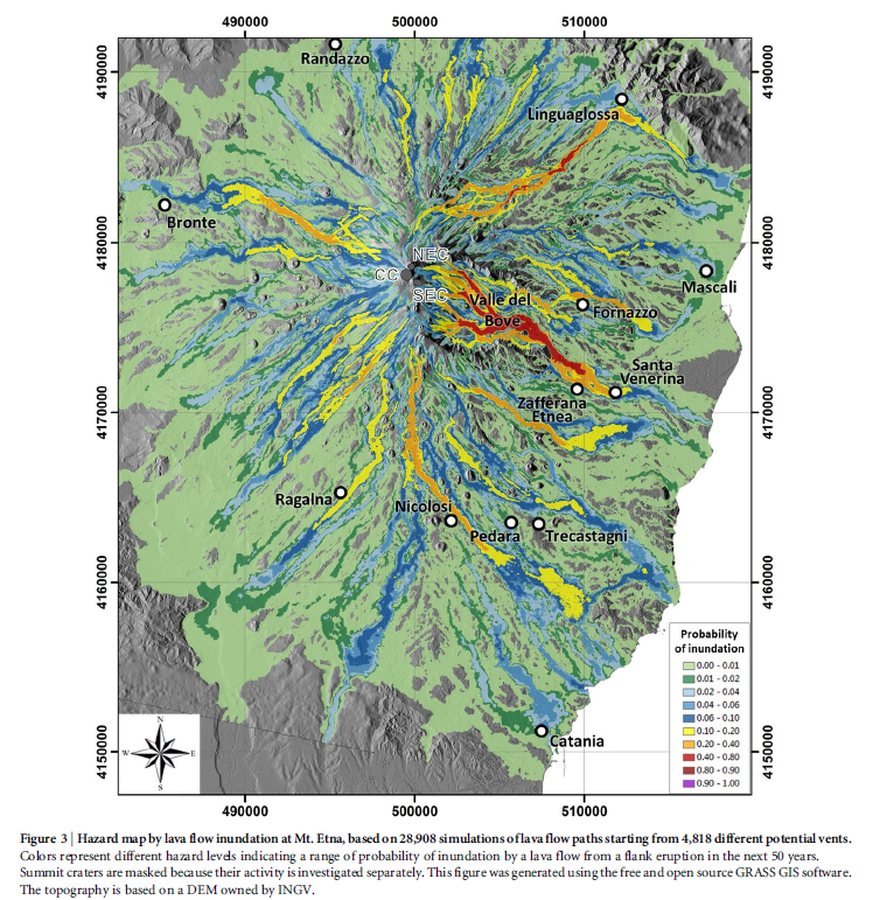
Figure in a journal article
Hazard map by lava flow inundation at Mt. Etna, based on 28,908 simulations of lava flow paths starting from 4,818 different potential vents.
Figure 3 in: Del Negro, C., Cappello, A., Neri, M., Bilotta, G., Hérault, A., & Ganci, G. (2013). Lava flow hazards at Mount Etna: constraints imposed by eruptive history and numerical simulations. Scientific Reports, 3(1). https://doi.org/10.1038/srep03493