
Advanced Search for Maps
Showing 1-10 of 19
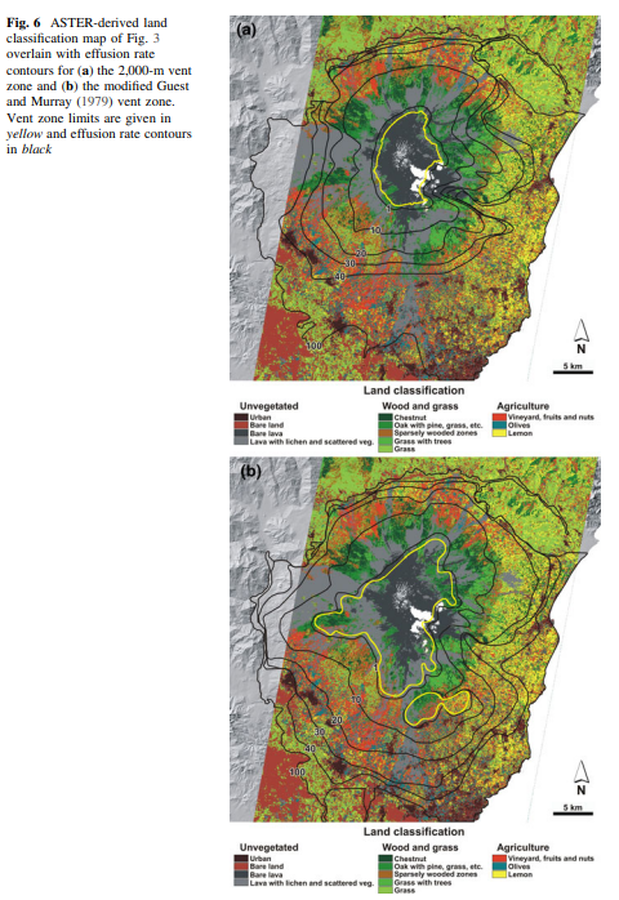
Figure in a journal article
ASTER-derived land classification map of Fig. 3 overlain with effusion rate contours for the 2,000-m vent zone and the modified Guest and Murray (1979) vent zone
Figure 6 in: Harris, A. J., Favalli, M., Wright, R., & Garbeil, H. (2011). Hazard assessment at Mount Etna using a hybrid lava flow inundation model and satellite-based land classification. Natural Hazards, 58(3), 1001-1027. https://doi.org/10.1007/s11069-010-9709-0
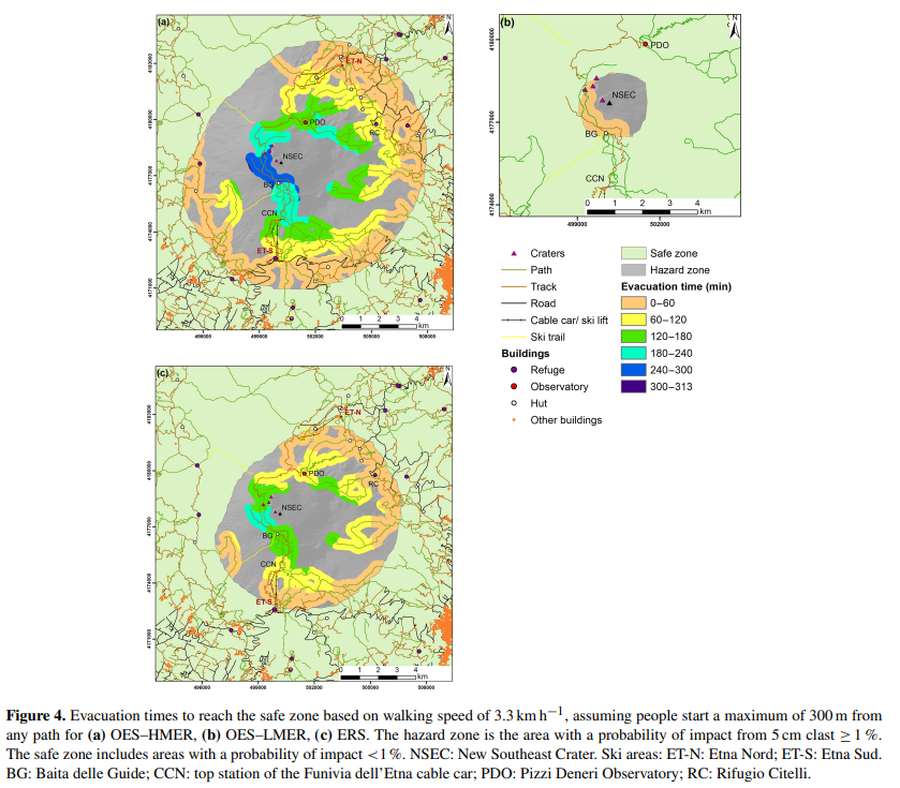
Figure in a journal article
Evacuation times to reach the safe zone based on walking speed of 3.3 km h^−1
Figure 4 in: Osman, S., Rossi, E., Bonadonna, C., Frischknecht, C., Andronico, D., Cioni, R., & Scollo, S. (2019). Exposure-based risk assessment and emergency management associated with the fallout of large clasts at Mount Etna. Natural Hazards and Earth System Sciences, 19(3), 589-610. https://doi.org/10.5194/nhess-19-589-2019
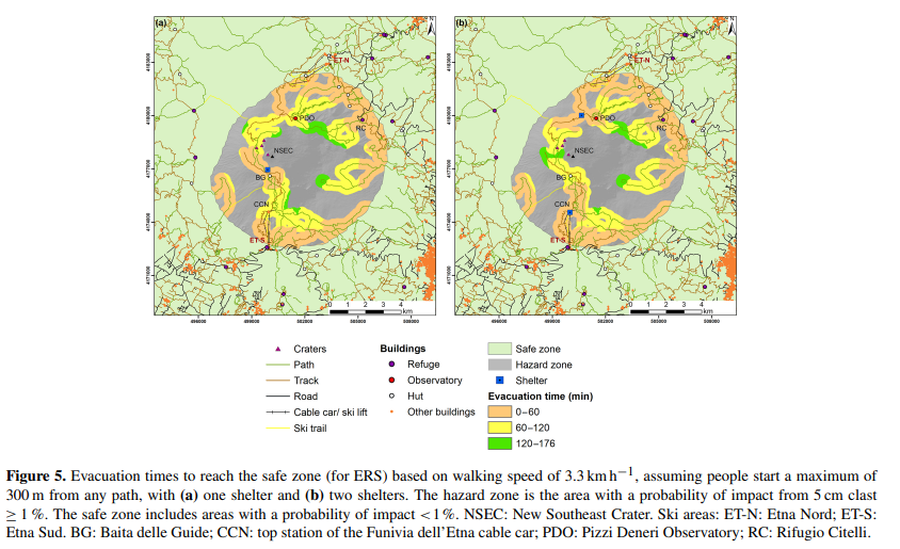
Figure in a journal article
Evacuation times to reach the safe zone based on walking speed of 3.3 km h^−1, assuming people start a maximum of 300 m from any path, with (a) one shelter and (b) two shelters
Figure 5 in: Osman, S., Rossi, E., Bonadonna, C., Frischknecht, C., Andronico, D., Cioni, R., & Scollo, S. (2019). Exposure-based risk assessment and emergency management associated with the fallout of large clasts at Mount Etna. Natural Hazards and Earth System Sciences, 19(3), 589-610. https://doi.org/10.5194/nhess-19-589-2019
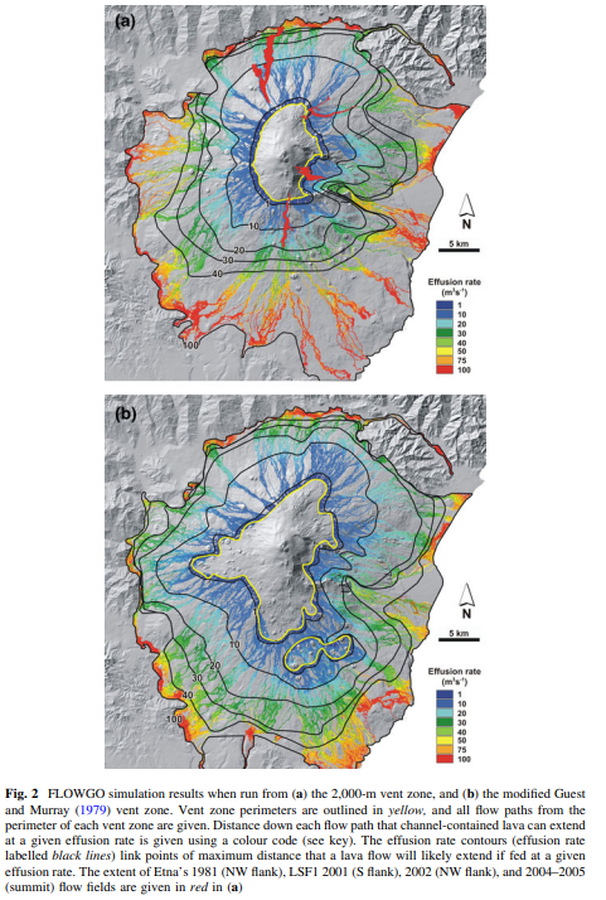
Figure in a journal article
FLOWGO simulation results when run from the 2,000-m vent zone, and the modified Guest and Murray (1979) vent zone.
Figure 2 in: Harris, A. J., Favalli, M., Wright, R., & Garbeil, H. (2011). Hazard assessment at Mount Etna using a hybrid lava flow inundation model and satellite-based land classification. Natural Hazards, 58(3), 1001-1027. https://doi.org/10.1007/s11069-010-9709-0
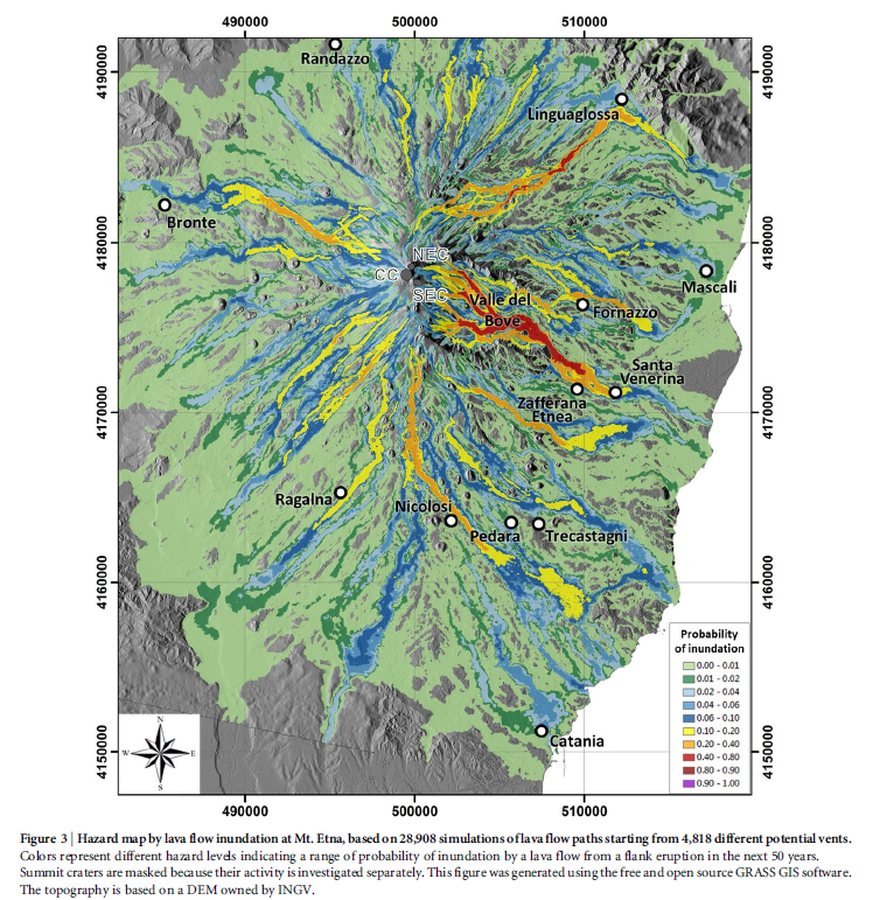
Figure in a journal article
Hazard map by lava flow inundation at Mt. Etna, based on 28,908 simulations of lava flow paths starting from 4,818 different potential vents.
Figure 3 in: Del Negro, C., Cappello, A., Neri, M., Bilotta, G., Hérault, A., & Ganci, G. (2013). Lava flow hazards at Mount Etna: constraints imposed by eruptive history and numerical simulations. Scientific Reports, 3(1). https://doi.org/10.1038/srep03493
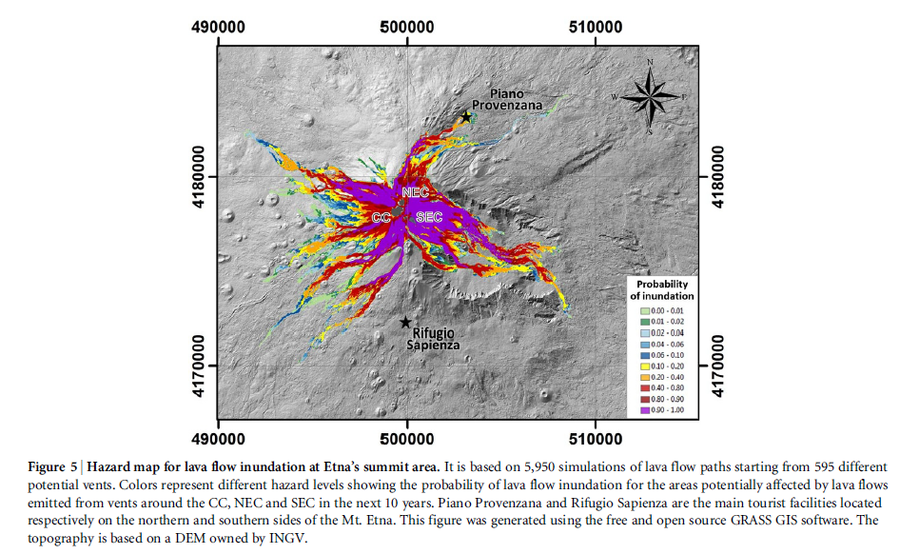
Figure in a journal article
Hazard map for lava flow inundation at Etna’s summit area.
Figure 5 in: Del Negro, C., Cappello, A., Neri, M., Bilotta, G., Hérault, A., & Ganci, G. (2013). Lava flow hazards at Mount Etna: constraints imposed by eruptive history and numerical simulations. Scientific Reports, 3(1). https://doi.org/10.1038/srep03493
Figure in a journal article
Hazard zones 1 (highest hazard) to 6 (lowest hazard, but highest vulnerability) based on the volcanological parameters of past eruptions, high vent density areas, and present day morphology
Figure 6 in: Behncke, B., Neri, M., & Nagay, A. (2005). Lava flow hazard at Mount Etna (Italy): new data from a GIS-based study. In: Manga, M. and Ventura, G. Kinematics and Dynamics of Lava Flows. Geological Society of America, Special Paper 396. https://doi.org/10.1130/0-8137-2396-5.189
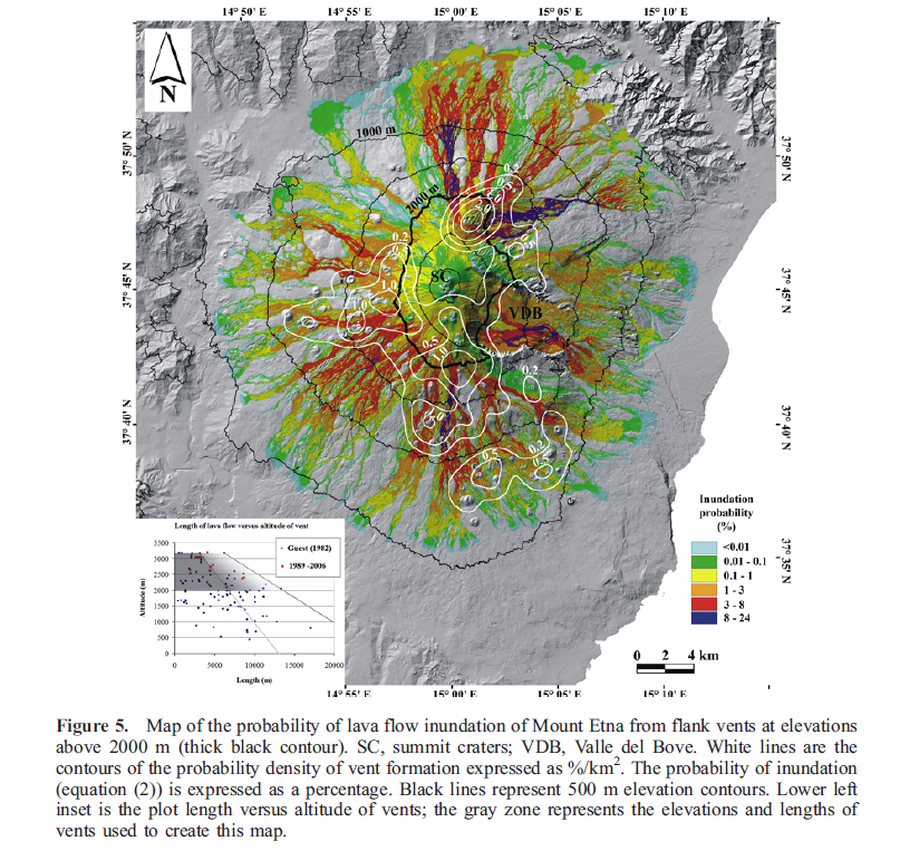
Figure in a journal article
Map of the probability of lava flow inundation of Mount Etna from flank vents at elevations above 2000 m
Figure 5 in: Favalli, M., Mazzarini, F., Pareschi, M. T., & Boschi, E. (2009). Topographic control on lava flow paths at Mount Etna, Italy: implications for hazard assessment. Journal of Geophysical Research: Earth Surface, 114(F1). https://doi.org/10.1029/2007JF000918

Figure in a journal article
Map of the probability of lava flow inundation of Mount Etna from flank vents at elevations above 2000 m calculated assuming a uniform probability of vent opening.
Figure 7 in: Favalli, M., Mazzarini, F., Pareschi, M. T., & Boschi, E. (2009). Topographic control on lava flow paths at Mount Etna, Italy: implications for hazard assessment. Journal of Geophysical Research: Earth Surface, 114(F1). https://doi.org/10.1029/2007JF000918
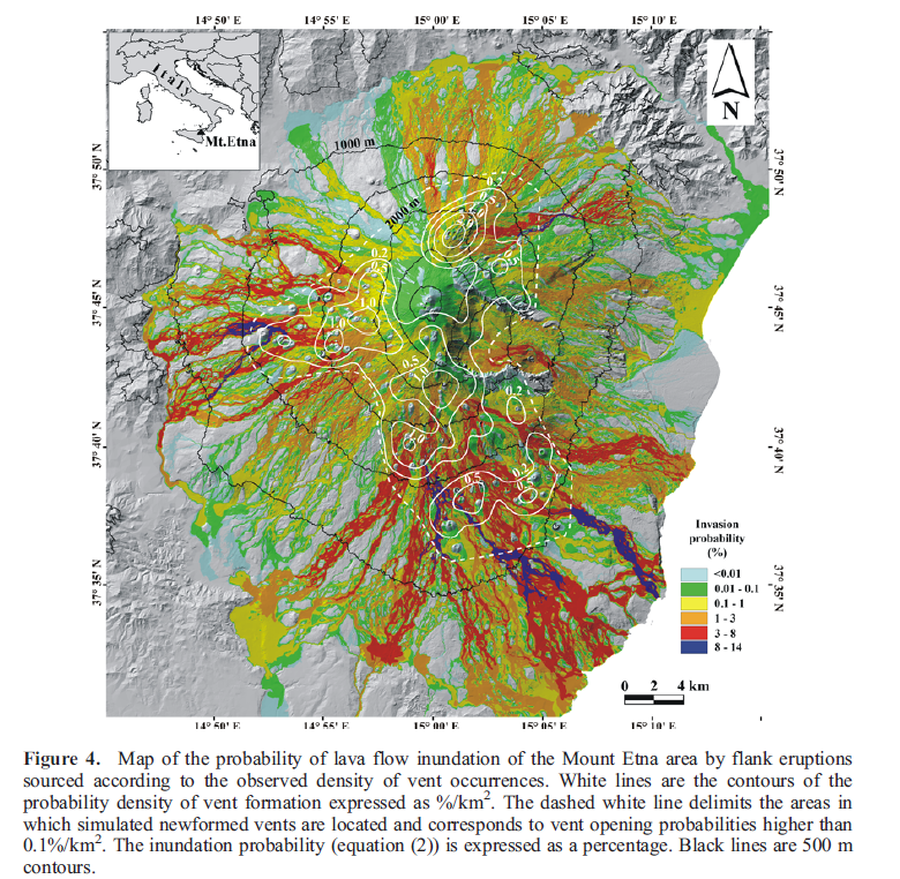
Figure in a journal article
Map of the probability of lava flow inundation of the Mount Etna area by flank eruptions sourced according to the observed density of vent occurrences
Figure 4 in: Favalli, M., Mazzarini, F., Pareschi, M. T., & Boschi, E. (2009). Topographic control on lava flow paths at Mount Etna, Italy: implications for hazard assessment. Journal of Geophysical Research: Earth Surface, 114(F1). https://doi.org/10.1029/2007JF000918
Page: 1 2