
Advanced Search for Maps
Showing 11-20 of 123
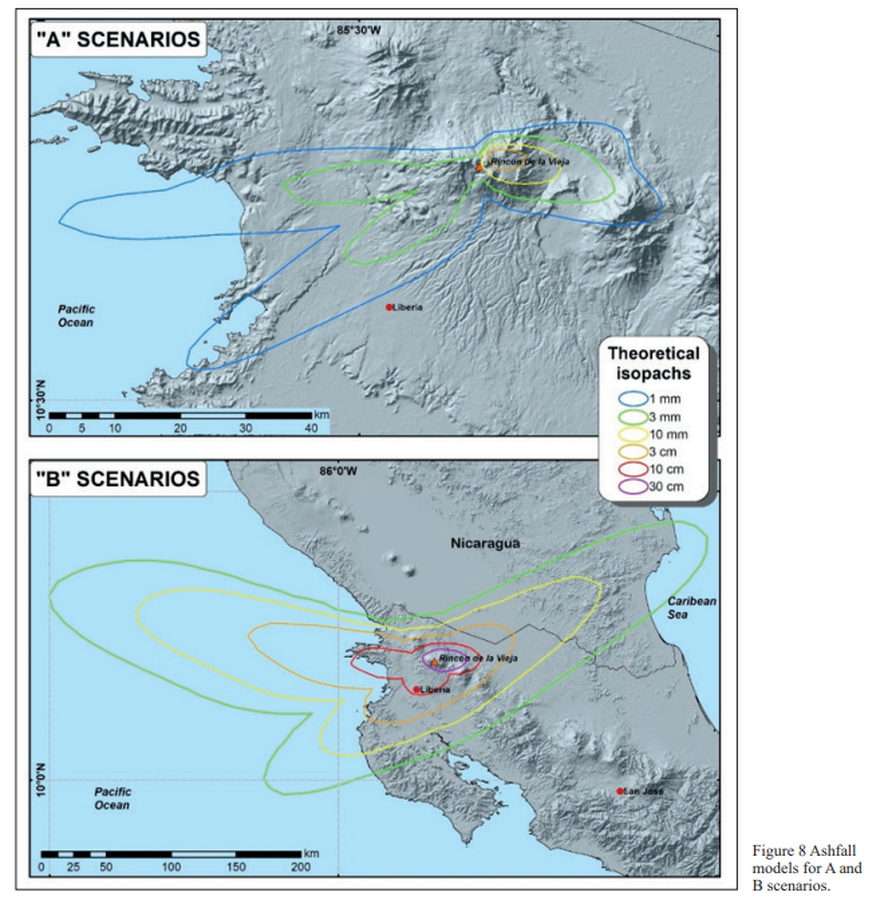
Figure in a journal article
Ashfall models for A and B scenarios
Figure 8 in: Alpízar, Y., Fernández, M., Ramírez, C., & Arroyo, D. (2019). Hazard Map of Rincón de la Vieja Volcano, Costa Rica: Qualitative Integration of Computer Simulations and Geological Data. Anuario do Instituto de Geociencias, 42(3). http://dx.doi.org/10.11137/2019_3_474_488
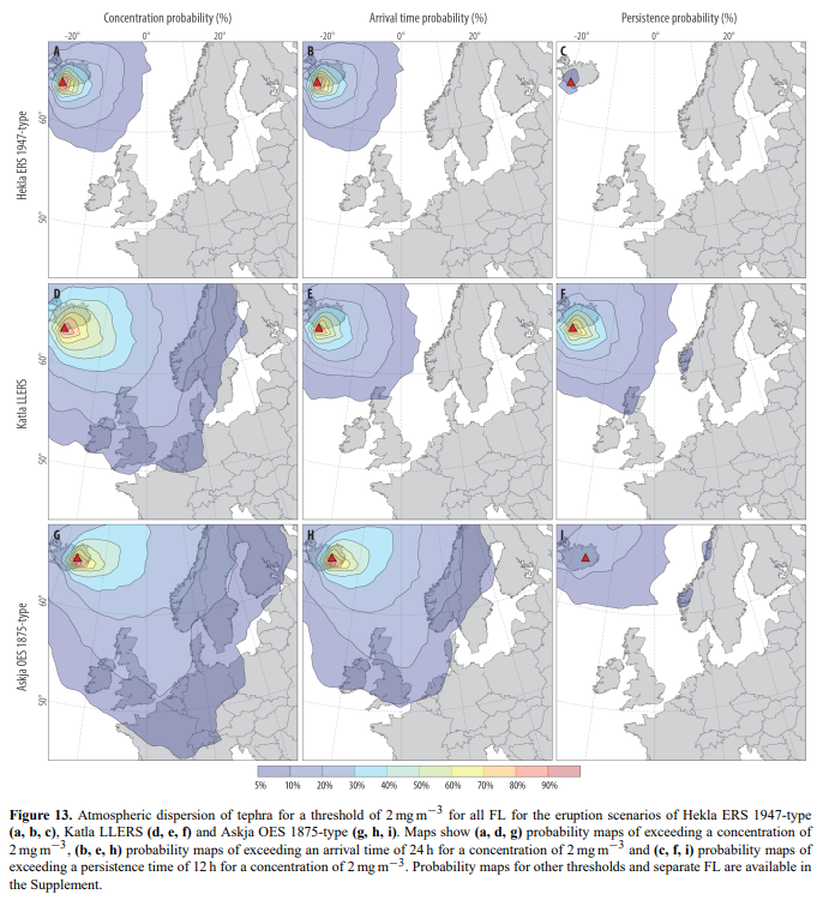
Figure in a journal article
Atmospheric dispersion of tephra for a threshold of 2 mg m−3 for all FL for the eruption scenarios of Hekla ERS 1947-type (a, b, c), Katla LLERS (d, e, f) and Askja OES 1875-type (g, h, i)
Figure 13 in: Biass, S., Scaini, C., Bonadonna, C., Folch, A., Smith, K., & Höskuldsson, A. (2014). A multi-scale risk assessment for tephra fallout and airborne concentration from multiple Icelandic volcanoes–Part 1: Hazard assessment. Natural hazards and earth system sciences, 14(8), 2265-2287. https://doi.org/10.5194/nhess-14-2265-2014

Official, Figure in hazard assessment
Cálculo por medio del ASH3D de la caída de ceniza de una columna eruptiva de 3 km de altura sobre el cráter del Rincón de la Vieja, según los vientos presentes en el área el 14 mayo 2022
(Calculation using ASH3D of the ash fall from a 3 km high eruptive column above the Rincón de la Vieja crater, according to the winds present in the area on May 14, 2022)
Figure 2.3 in: Alvarado, G.E., Brenes-André, J., Venegas, L., Alpízar, Y., Núñez, S., Sánchez, M., Abarca, K., Abarca, J., Báez, W.A., Sibaja, J.P., Esquivel, L., & Arcia, T. (2022). Análisis del Peligro Volcánico del Rincón de la Vieja, Costa Rica. Instituto Costarricense de Electricidad (ICE). Setiembre 2022.

Official, Figure in hazard assessment
Composite Area of Possible Ash Fallout in Upper Cook Inlet for a Future Eruption of Iliamna Volcano
Figure 9 in: Waythomas, C.F. & Miller, T.P. (1999). Preliminary volcano-hazard assessment for Iliamna Volcano, Alaska. U.S. Geological Survey, Open-File Report 99-373, 31 p., 1 plate. https://doi.org/10.3133/ofr99373
Official, Figure in hazard assessment
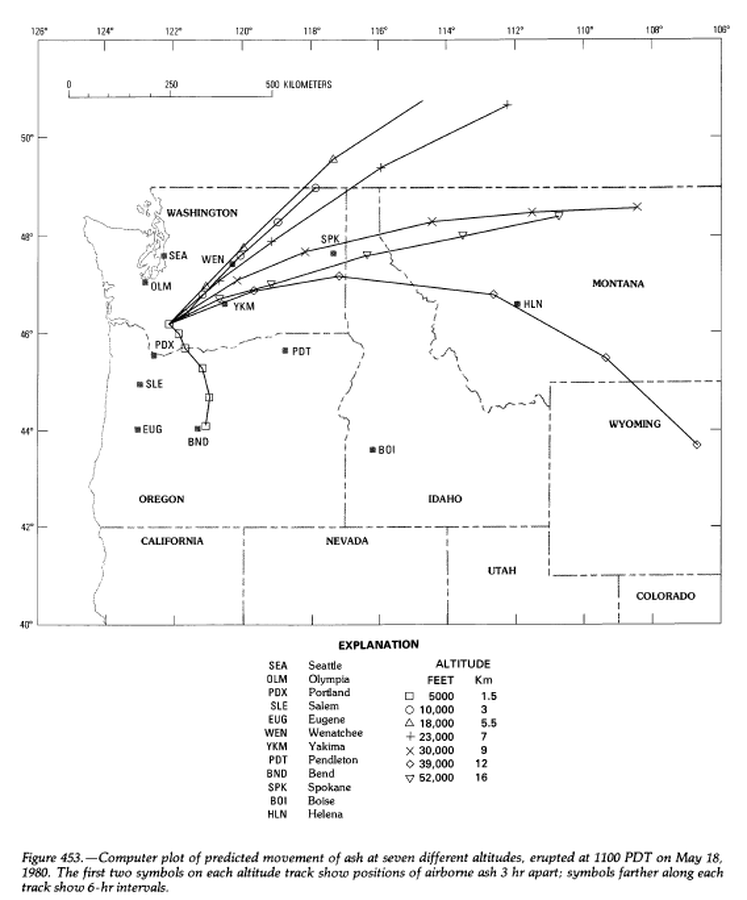
Computer plot of predicted movement of ash at seven different altitudes, erupted at 1100 PDT on May 18, 1980.
Figure 453 in: Miller, C.D., Mullineaux, D.R. & Crandell, D.R. (1981). Hazards assessments at Mount St. Helens. In: Lipman, P. W. & Mullineaux, D. R. (Eds.) The 1980 eruptions of Mount St. Helens, Washington. U.S. Geological Survey, Professional Paper 1250, p. 789-802. https://doi.org/10.3133/pp1250
Official, Figure in a journal article
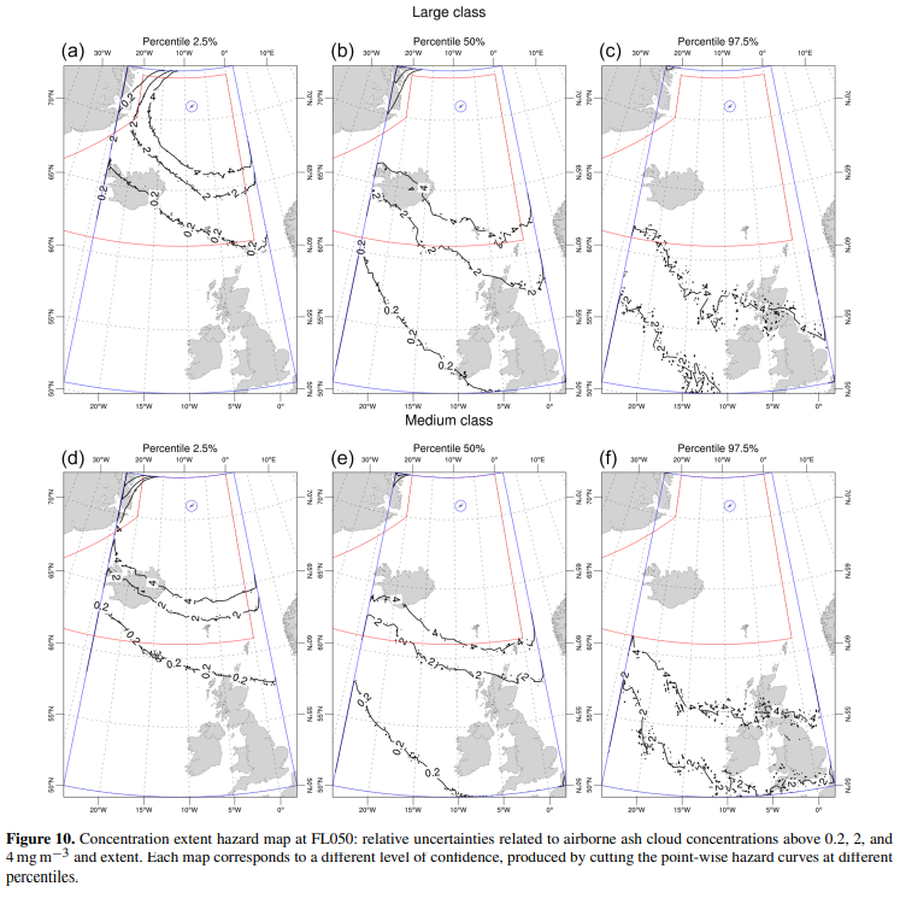
Concentration extent hazard map at FL050
Figure 10 in: Titos, M., Martínez Montesinos, B., Barsotti, S., Sandri, L., Folch, A., Mingari, L., Macedonio, G. & Costa, A. (2022). Long-term hazard assessment of explosive eruptions at Jan Mayen (Norway) and implications for air traffic in the North Atlantic. Natural Hazards and Earth System Sciences, 22(1), 139-163. https://doi.org/10.5194/nhess-22-139-2022
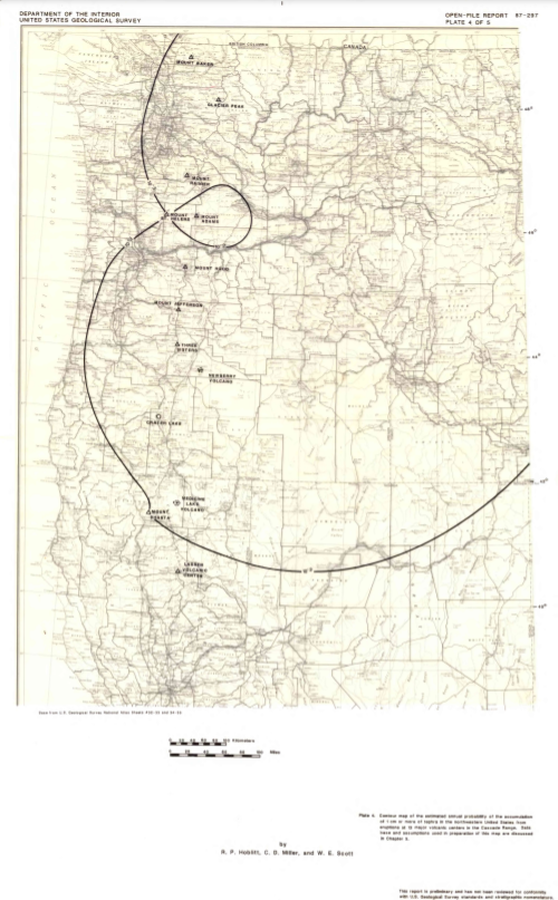
Official, Insert/poster-size map with accompanying report
Contour map of the estimated annual probability of the accumulation of 1 cm or more of tephra in the northwestern United States at eruptions at 13 major volcanic centers in the Cascades Range
Plate 4 in: Hoblitt, R. P., Miller, C. D., & Scott, W. E. (1987). Volcanic hazards with regard to siting nuclear-power plants in the Pacific Northwest. U.S. Geological Survey, Open-File Report 87-297. https://doi.org/10.3133/ofr87297
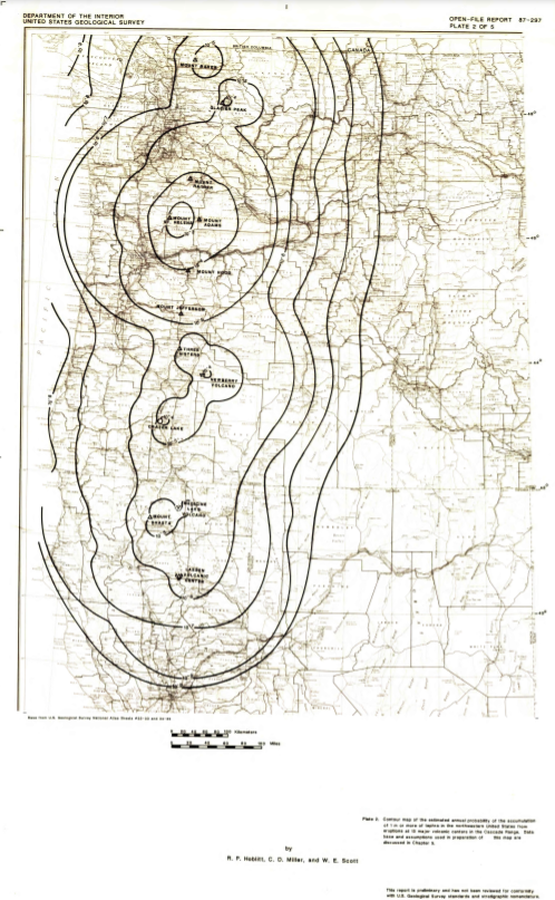
Official, Insert/poster-size map with accompanying report
Contour map of the estimated annual probability of the accumulation of 1 m or more of tephra in the northwestern United States at eruptions at 13 major volcanic centers in the Cascades Range
Plate 2 in: Hoblitt, R. P., Miller, C. D., & Scott, W. E. (1987). Volcanic hazards with regard to siting nuclear-power plants in the Pacific Northwest. U.S. Geological Survey, Open-File Report 87-297. https://doi.org/10.3133/ofr87297
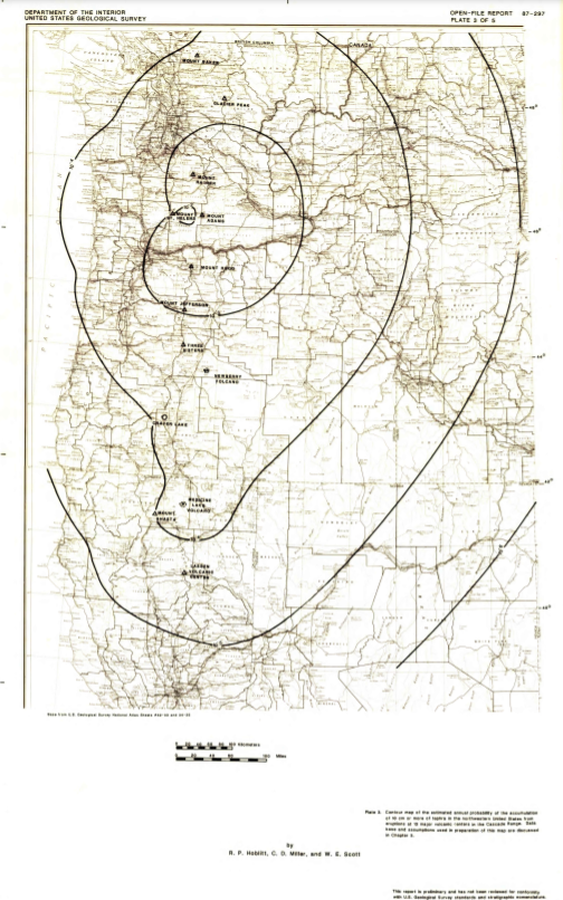
Official, Insert/poster-size map with accompanying report
Contour map of the estimated annual probability of the accumulation of 10 cm or more of tephra in the northwestern United States at eruptions at 13 major volcanic centers in the Cascades Range
Plate 3 in: Hoblitt, R. P., Miller, C. D., & Scott, W. E. (1987). Volcanic hazards with regard to siting nuclear-power plants in the Pacific Northwest. U.S. Geological Survey, Open-File Report 87-297. https://doi.org/10.3133/ofr87297
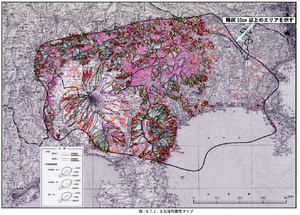
Official, Figure in hazard assessment
Debris flow possibility map
Figure 5.7.1 in: Mt. Fuji Hazard Map Review Committee. (2004). Mt. Fuji Hazard Map Review Committee Report. June 2004. https://www.bousai.go.jp/kazan/fuji_map/pdf/report_200406.pdf