
Advanced Search for Maps
Showing 31-40 of 123
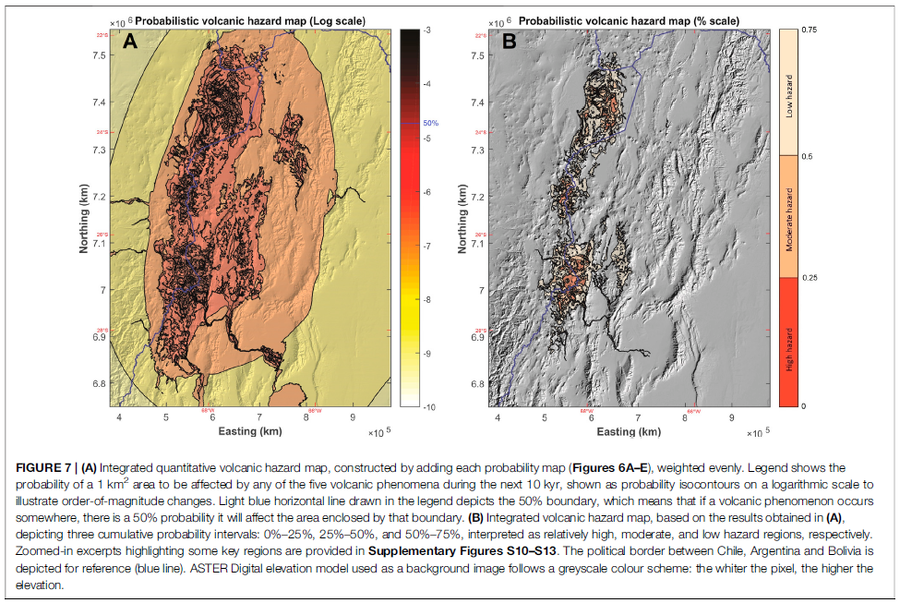
Figure in a journal article
Integrated quantitative volcanic hazard map, constructed by adding each probability map (Figures 6A–E), weighted evenly
Figure 7 in: Bertin, D., Lindsay, J.M., Cronin, S.J., de Silva, S.L., Connor, C.B., Caffe, P.J., Grosse, P., Báez, W., Bustos, E., & Constantinescu, R. (2022). Probabilistic Volcanic Hazard Assessment of the 22.5–28° S Segment of the Central Volcanic Zone of the Andes. Frontiers in Earth Science, 10. https://doi.org/10.3389/feart.2022.875439
Official, Figure in hazard assessment
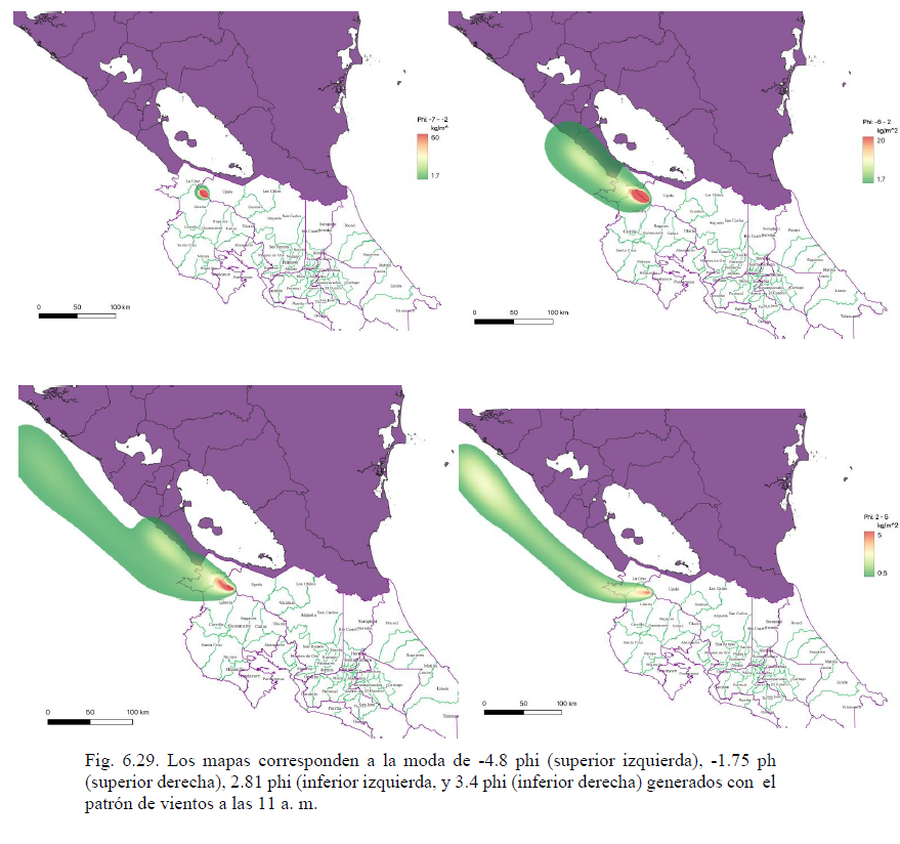
Los mapas corresponden a la moda de -4.8 phi (superior izquierda), -1.75 phi (superior derecha) generados con el patrón de vientos a las 11 a.m.
(The maps correspond to the -4.8 phi (top left), -1.75 phi (top right) mode generated with the 11 a.m. wind pattern.)
Figure 6.29 in: Alvarado, G.E., Brenes-André, J., Venegas, L., Alpízar, Y., Núñez, S., Sánchez, M., Abarca, K., Abarca, J., Báez, W.A., Sibaja, J.P., Esquivel, L., & Arcia, T. (2022). Análisis del Peligro Volcánico del Rincón de la Vieja, Costa Rica. Instituto Costarricense de Electricidad (ICE). Setiembre 2022.
Official, Figure in hazard assessment
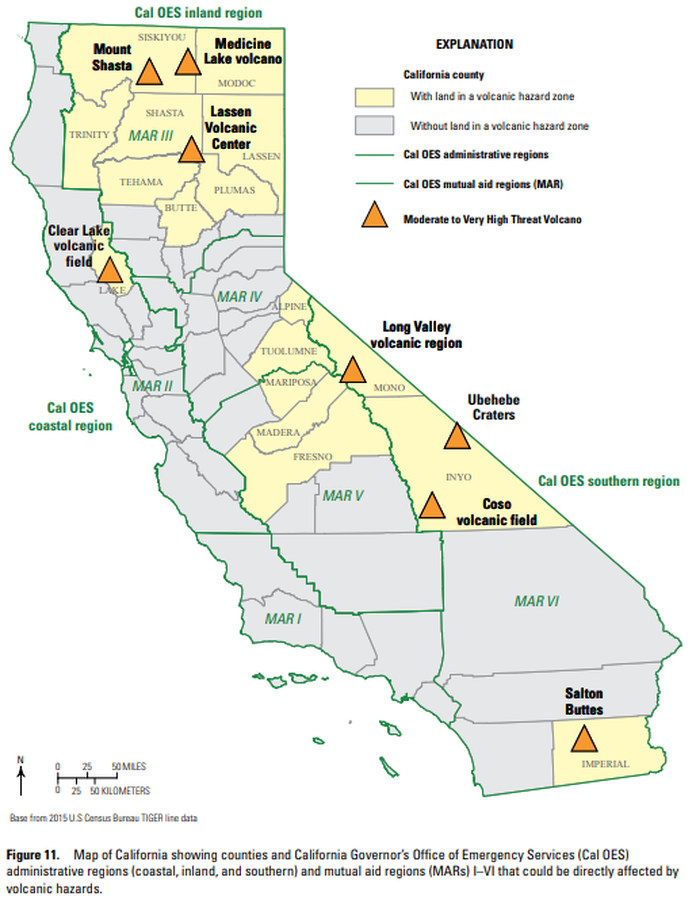
Map of California showing counties and California Governor’s Office of Emergency Services (Cal OES) administrative regions (coastal, inland, and southern) and mutual aid regions (MARs) I–VI that could be directly affected by volcanic hazards.
Figure 11 in: Mangan, M., Ball, J., Wood, N., Jones, J.L., Peters, J., Abdollahian, N., Dinitz, L., Blankenheim, S., Fenton, J., & Pridmore, C. (2019). California’s exposure to volcanic hazards. U.S. Geological Survey Scientific Investigations Report 2018–5159, v. 1.1, 49 p. https://doi.org/10.3133/sir20185159
Official, Figure in hazard assessment
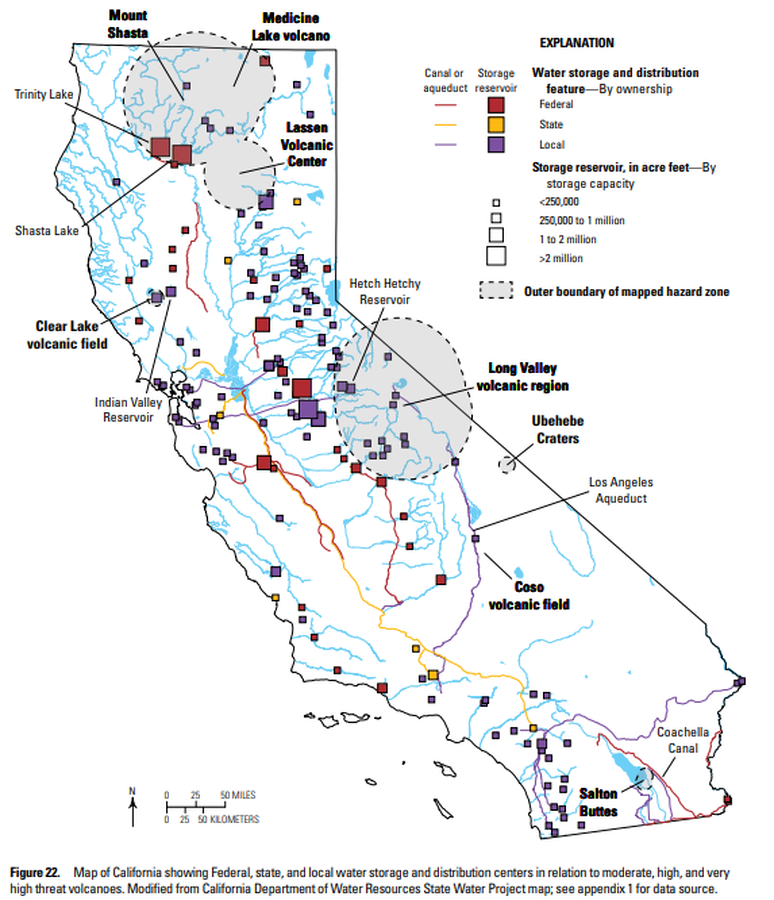
Map of California showing Federal, state, and local water storage and distribution centers in relation to moderate, high, and very high threat volcanoes
Figure 22 in: Mangan, M., Ball, J., Wood, N., Jones, J.L., Peters, J., Abdollahian, N., Dinitz, L., Blankenheim, S., Fenton, J., & Pridmore, C. (2019). California’s exposure to volcanic hazards. U.S. Geological Survey Scientific Investigations Report 2018–5159, v. 1.1, 49 p. https://doi.org/10.3133/sir20185159
Official, Figure in hazard assessment
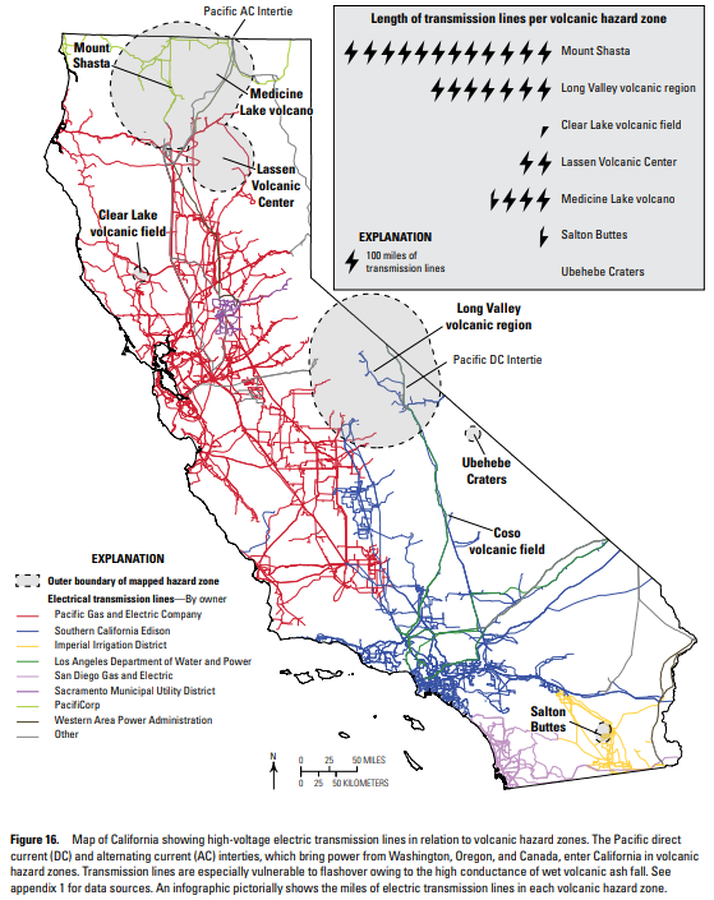
Map of California showing high-voltage electric transmission lines in relation to volcanic hazard zones
Figure 16 in: Mangan, M., Ball, J., Wood, N., Jones, J.L., Peters, J., Abdollahian, N., Dinitz, L., Blankenheim, S., Fenton, J., & Pridmore, C. (2019). California’s exposure to volcanic hazards. U.S. Geological Survey Scientific Investigations Report 2018–5159, v. 1.1, 49 p. https://doi.org/10.3133/sir20185159

Official, Figure in hazard assessment
Map of natural gas pipelines and substations in northern California
Figure 20 in: Mangan, M., Ball, J., Wood, N., Jones, J.L., Peters, J., Abdollahian, N., Dinitz, L., Blankenheim, S., Fenton, J., & Pridmore, C. (2019). California’s exposure to volcanic hazards. U.S. Geological Survey Scientific Investigations Report 2018–5159, v. 1.1, 49 p. https://doi.org/10.3133/sir20185159
Official, Figure in hazard assessment
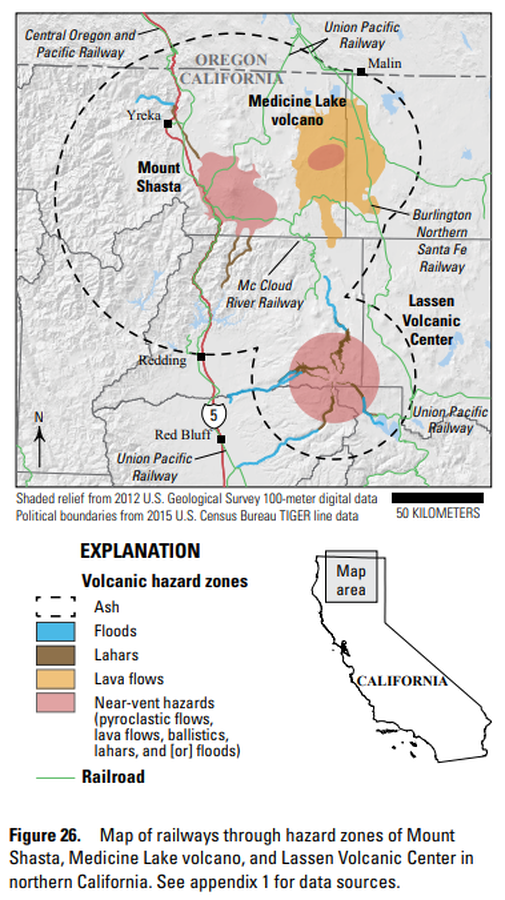
Map of railways through hazard zones of Mount Shasta, Medicine Lake volcano, and Lassen Volcanic Center in northern California
Figure 26 in: Mangan, M., Ball, J., Wood, N., Jones, J.L., Peters, J., Abdollahian, N., Dinitz, L., Blankenheim, S., Fenton, J., & Pridmore, C. (2019). California’s exposure to volcanic hazards. U.S. Geological Survey Scientific Investigations Report 2018–5159, v. 1.1, 49 p. https://doi.org/10.3133/sir20185159
Official, Figure in hazard assessment
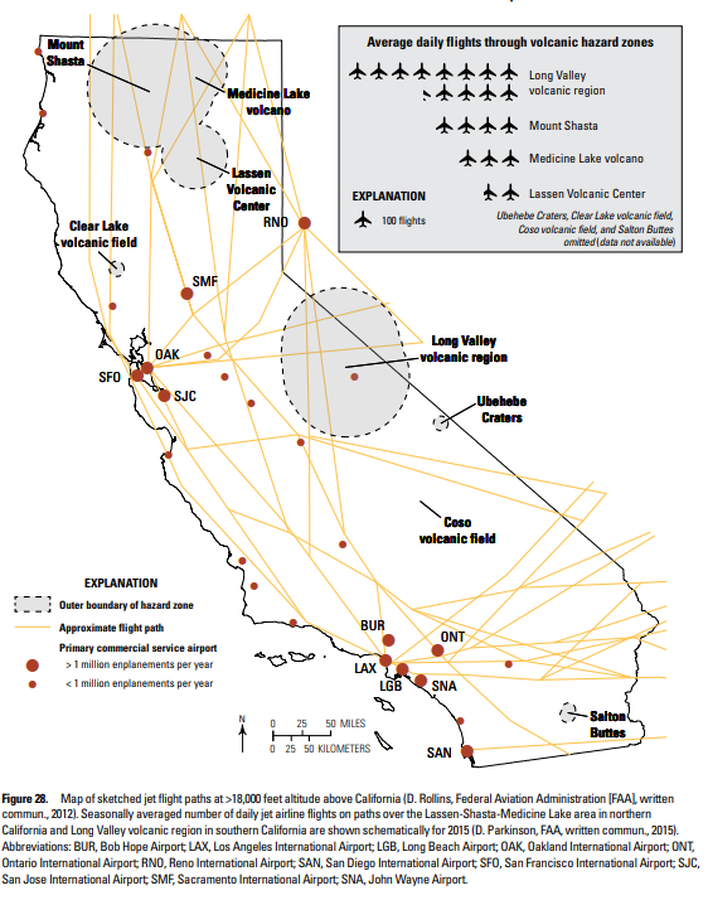
Map of sketched jet flight paths at >18,000 feet altitude above California
Figure 28 in: Mangan, M., Ball, J., Wood, N., Jones, J.L., Peters, J., Abdollahian, N., Dinitz, L., Blankenheim, S., Fenton, J., & Pridmore, C. (2019). California’s exposure to volcanic hazards. U.S. Geological Survey Scientific Investigations Report 2018–5159, v. 1.1, 49 p. https://doi.org/10.3133/sir20185159
Official, Figure in hazard assessment
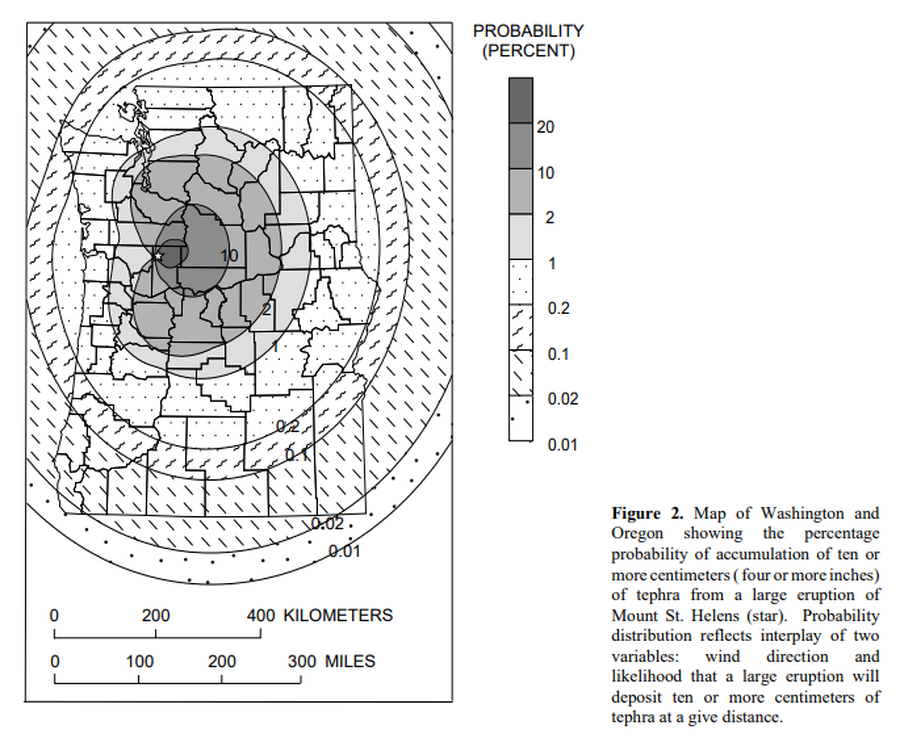
Map of Washington and Oregon showing the percentage probability of accumulation of ten or more centimeters (four or more inches) of tephra from a large eruptions of Mount St. Helens.
Figure 2 in: Wolfe, E.W. & Pierson, T.C. (1995). Volcanic-Hazard Zonation for Mount St. Helens, Washington, 1995. U.S. Geological Survey, Open-File Report 95-497, 12 p., 1 plate. https://doi.org/10.3133/ofr95497
Official, Figure in hazard assessment
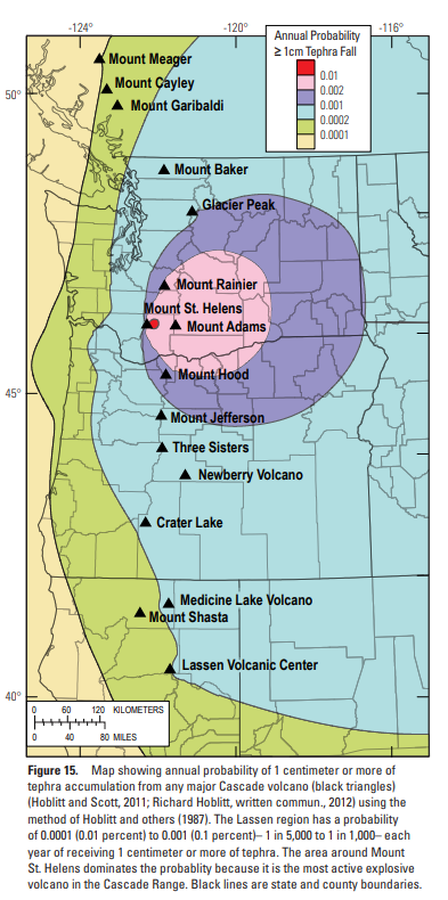
Map showing annual probability of 1 centimeter or more of tephra accumulation from any major Cascade volcano
Figure 15 in: Clynne, M. A., Robinson, J. E., Nathenson, M. & Muffler, L. P. (2012). Volcano hazards assessment for the Lassen region, northern California. U.S. Geological Survey, Scientific Investigations Report 2012-5176-A, 47 p., 1 plate. https://doi.org/10.3133/sir20125176A