
Advanced Search for Maps
Showing 21-30 of 123
Official, Figure in hazard assessment
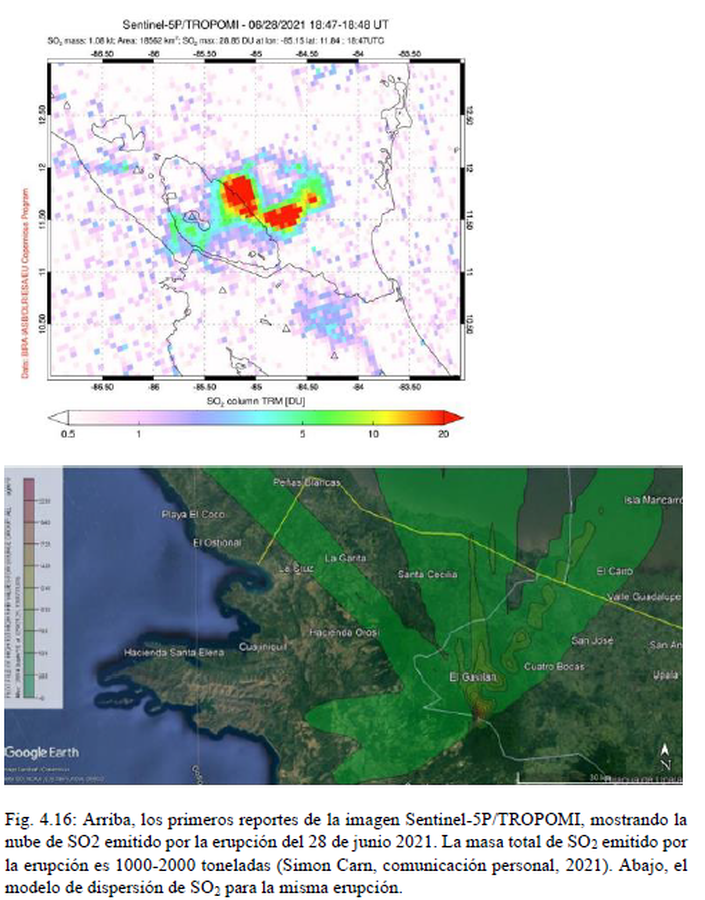
El modelo de dispersión de SO2 para la misma erupción
(The SO2 dispersion model for the same eruption)
Figure 4.16 in: Alvarado, G.E., Brenes-André, J., Venegas, L., Alpízar, Y., Núñez, S., Sánchez, M., Abarca, K., Abarca, J., Báez, W.A., Sibaja, J.P., Esquivel, L., & Arcia, T. (2022). Análisis del Peligro Volcánico del Rincón de la Vieja, Costa Rica. Instituto Costarricense de Electricidad (ICE). Setiembre 2022.
Official, Figure on website
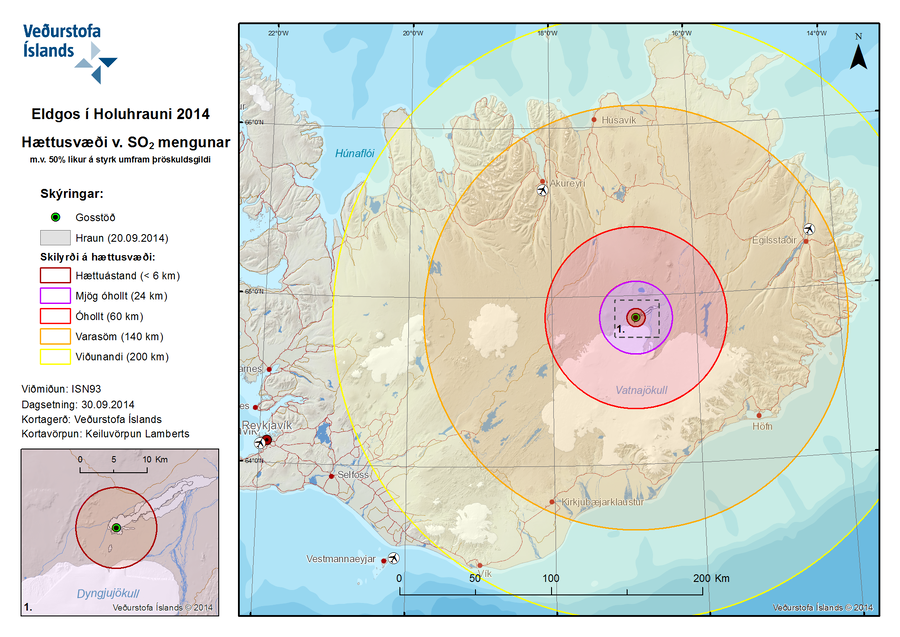
Eldgos í Holuhrauni 2014 Hættusvæði v. SO2 Mengunar m.v. 50% líkur á styrk umfram þröskuldsgildi
(Volcanic Eruption at Holuhraun 2014 Hazardous Area SO2 pollution 50% likelihood of concentration exceeding a threshold value)
Iceland Meteorological Office (IMO). (2014). Eldgos í Holuhrauni 2014 Hættusvæði v. SO2 Mengunar [Volcanic Eruption at Holuhraun 2014 Hazardous Area SO2 pollution]. (Reprinted in: Barsotti, S. (2015). Hazard Zoning: Probabilistic hazard maps of SO2 ground concentration for Holuhraun eruption. https://en.vedur.is/pollution-and-radiation/volcanic-gas/hazard-zoning/)
Official, Figure on website
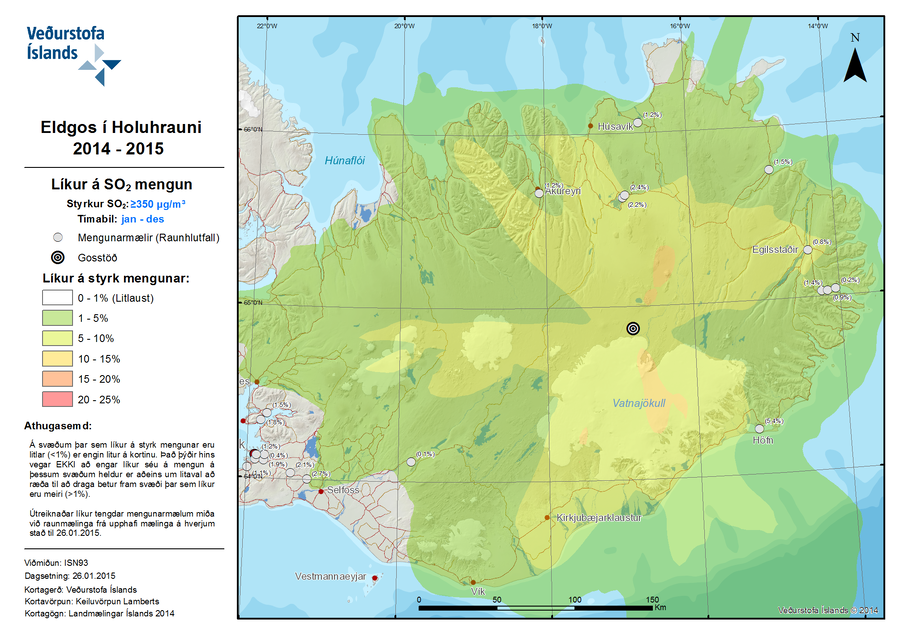
Eldgos í Holuhrauni 2014-2015 Líkur á SO2 Mengun
(Volcanic Eruption at Holuhraun 2014-2015 Probability of SO2 Contamination)
Iceland Meteorological Office (IMO). (2015). Eldgos í Holuhrauni 2014-2015 Líkur á SO2 Mengun [Volcanic Eruption at Holuhraun 2014-2015 Probability of SO2 Contamination]. (Reprinted in: Barsotti, S. (2015). Hazard Zoning: Probabilistic hazard maps of SO2 ground concentration for Holuhraun eruption. https://en.vedur.is/pollution-and-radiation/volcanic-gas/hazard-zoning/)
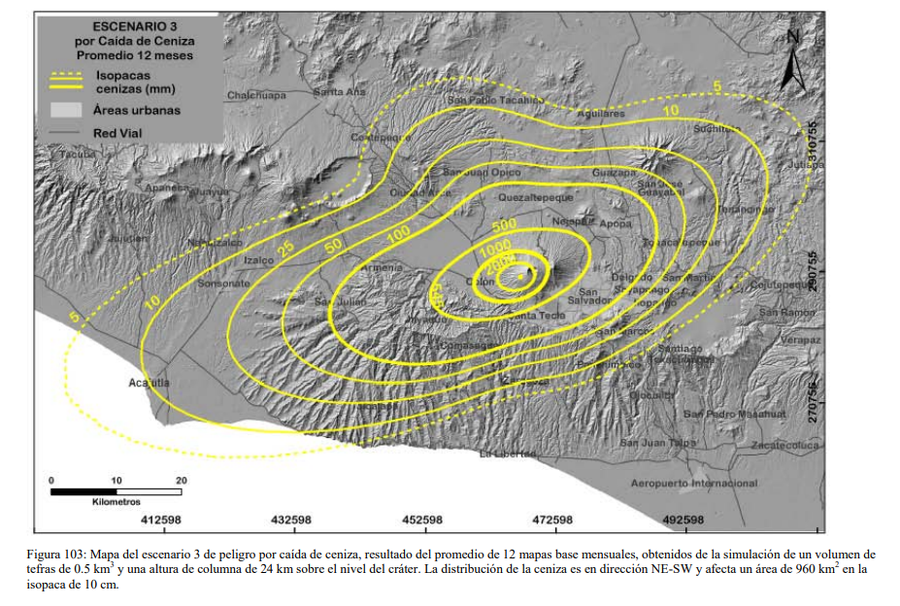
Figure in a thesis or dissertation
Escenario 3 por Caida de Ceniza Promedio 12 Meses
(Scenario 3 for Average Ash Fall 12 Months)
Figure 103 in: Ferrés López, M.D. (2014). Estratigrafía, Geología y Evaluación de Peligros Volcánicos del Complejo Volcánico de San Salvador (El Salvador). Doctoral Thesis, Universidad Autónoma de México, México.
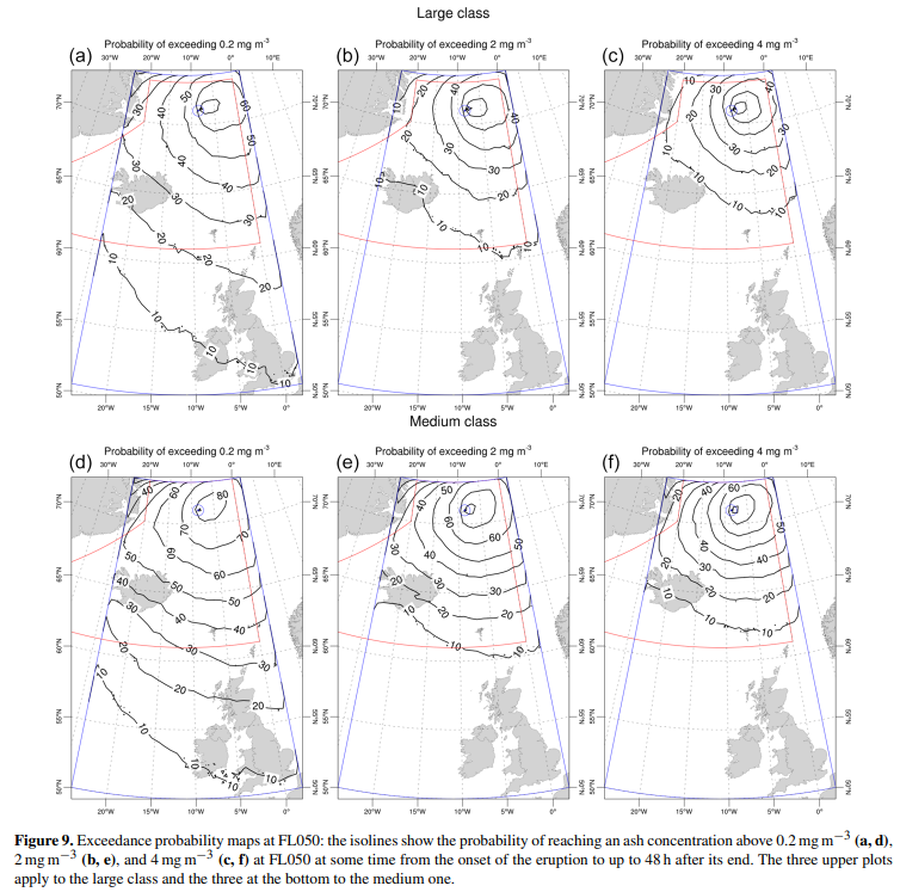
Official, Figure in a journal article
Exceedance probability maps at FL050
Figure 9 in: Titos, M., Martínez Montesinos, B., Barsotti, S., Sandri, L., Folch, A., Mingari, L., Macedonio, G. & Costa, A. (2022). Long-term hazard assessment of explosive eruptions at Jan Mayen (Norway) and implications for air traffic in the North Atlantic. Natural Hazards and Earth System Sciences, 22(1), 139-163. https://doi.org/10.5194/nhess-22-139-2022
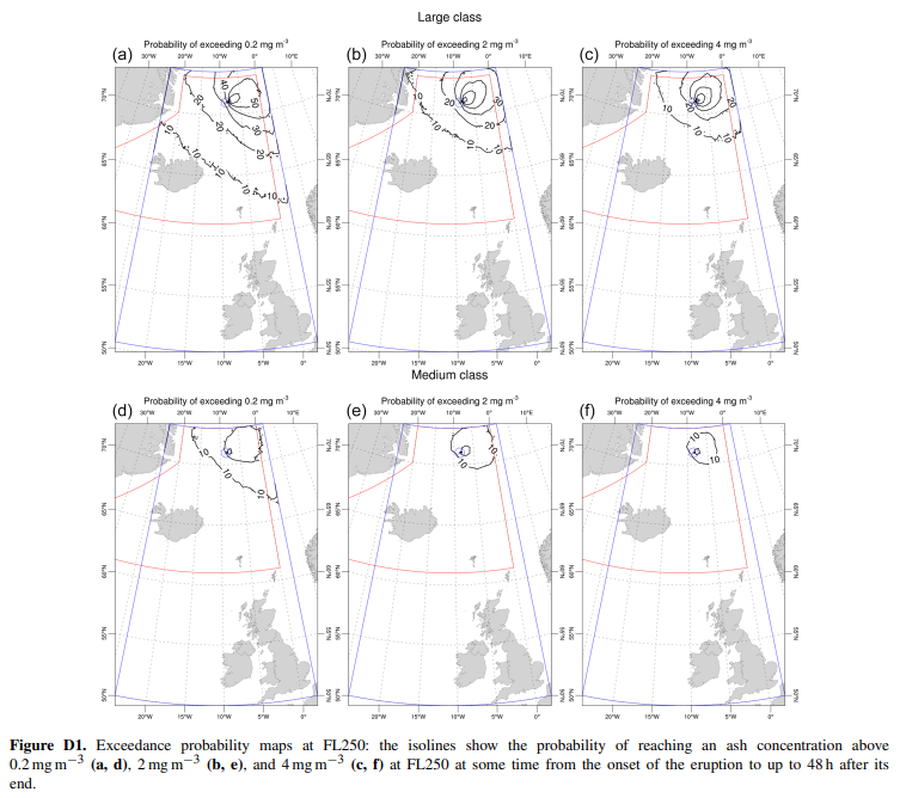
Official, Figure in a journal article
Exceedance probability maps at FL250
Figure D1 in: Titos, M., Martínez Montesinos, B., Barsotti, S., Sandri, L., Folch, A., Mingari, L., Macedonio, G. & Costa, A. (2022). Long-term hazard assessment of explosive eruptions at Jan Mayen (Norway) and implications for air traffic in the North Atlantic. Natural Hazards and Earth System Sciences, 22(1), 139-163. https://doi.org/10.5194/nhess-22-139-2022
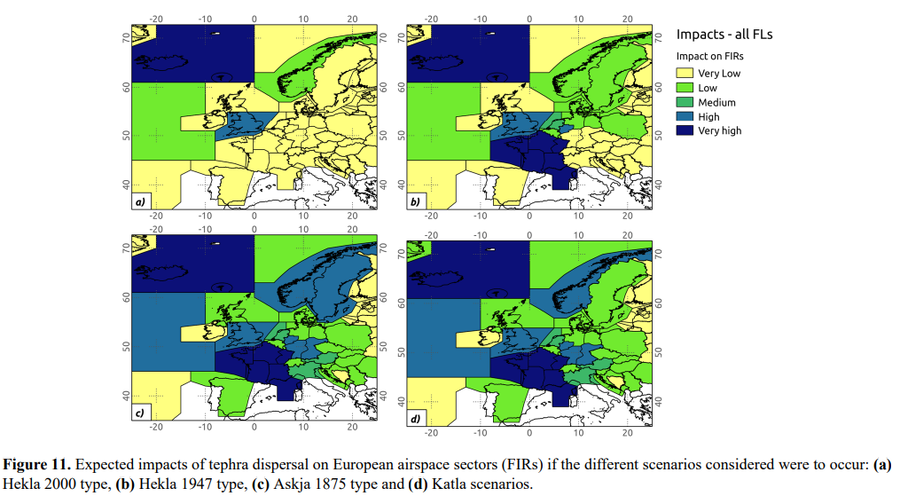
Figure in a journal article
Expected impacts of tephra dispersal on European airspace sectors
Figure 11 in: Scaini, C., Biass, S., Galderisi, A., Bonadonna, C., Folch, A., Smith, K., & Höskuldsson, A. (2014). A multi-scale risk assessment for tephra fallout and airborne concentration from multiple Icelandic volcanoes–Part 2: Vulnerability and impact. Natural hazards and earth system sciences, 14(8), 2289–2312. https://doi.org/10.5194/nhess-14-2289-2014
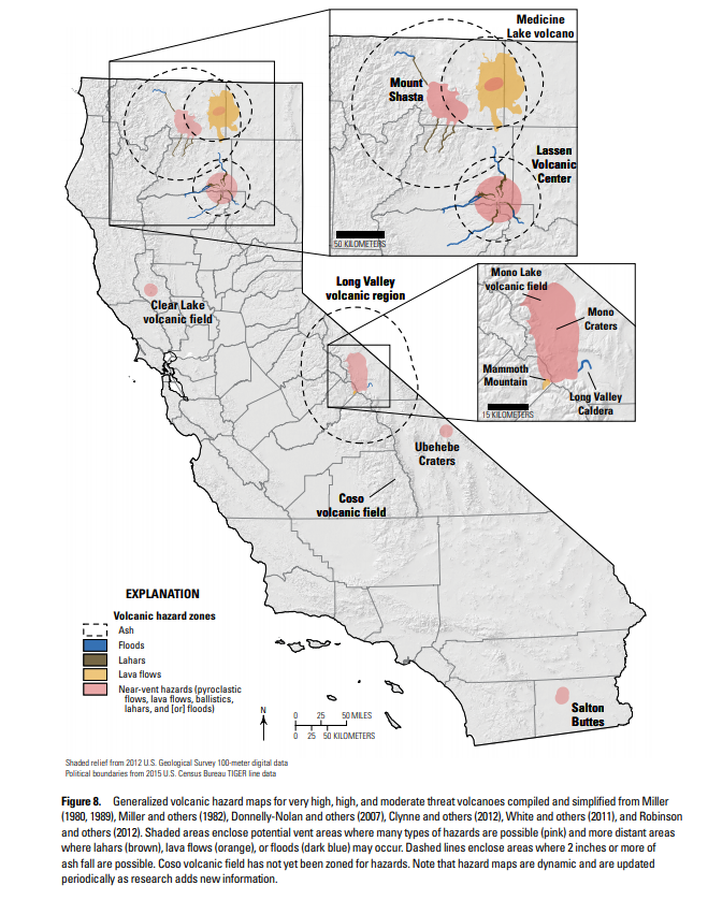
Official, Figure in hazard assessment
Generalized volcanic hazard maps for very high, high, and moderate threat volcanoes compiled and simplified from Miller (1980, 1989), Miller and others (1982), Donnelly-Nolan and others (2007), Clynne and others (2012), White and others (2011), and Robinson and others (2012)
Figure 8 in: Mangan, M., Ball, J., Wood, N., Jones, J.L., Peters, J., Abdollahian, N., Dinitz, L., Blankenheim, S., Fenton, J., & Pridmore, C. (2019). California’s exposure to volcanic hazards. U.S. Geological Survey Scientific Investigations Report 2018–5159, v. 1.1, 49 p. https://doi.org/10.3133/sir20185159
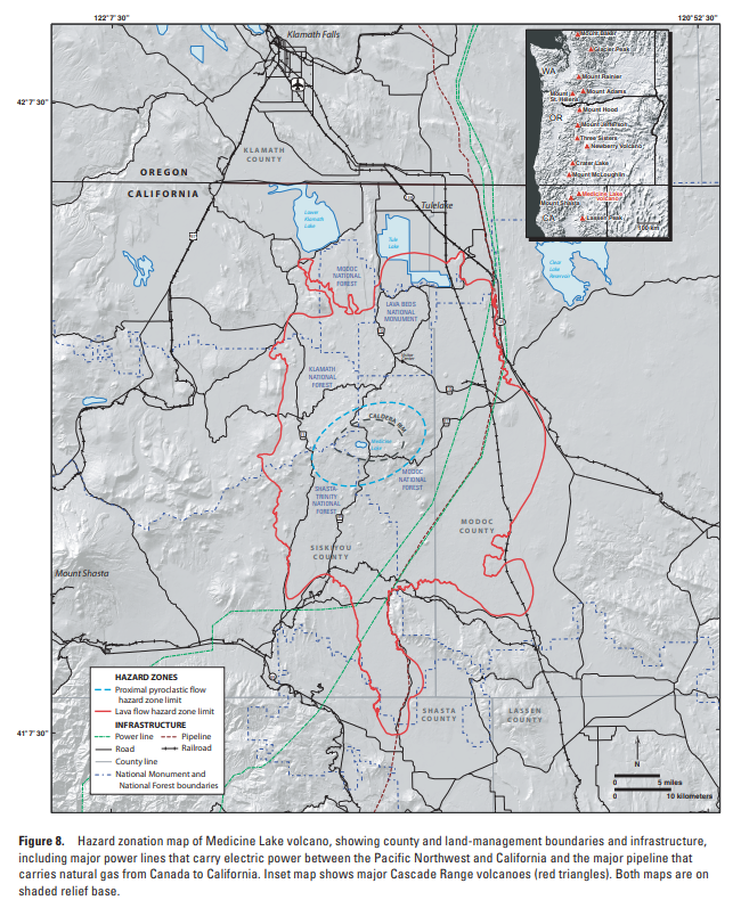
Official, Figure in hazard assessment
Hazard zonation map of Medicine Lake volcano, showing county and land-management boundaries and infrastructure
Figure 8 in: Donnelly-Nolan, J.M., Nathenson, M., Champion, D.E., Ramsey, D.W., Lowenstern, J.B., & Ewert, J.W. (2007). Volcano Hazards Assessment for Medicine Lake Volcano, Northern California. Scientitic Investigations Report 2007-5174-A. Plate 1. https://doi.org/10.3133/sir20075174A
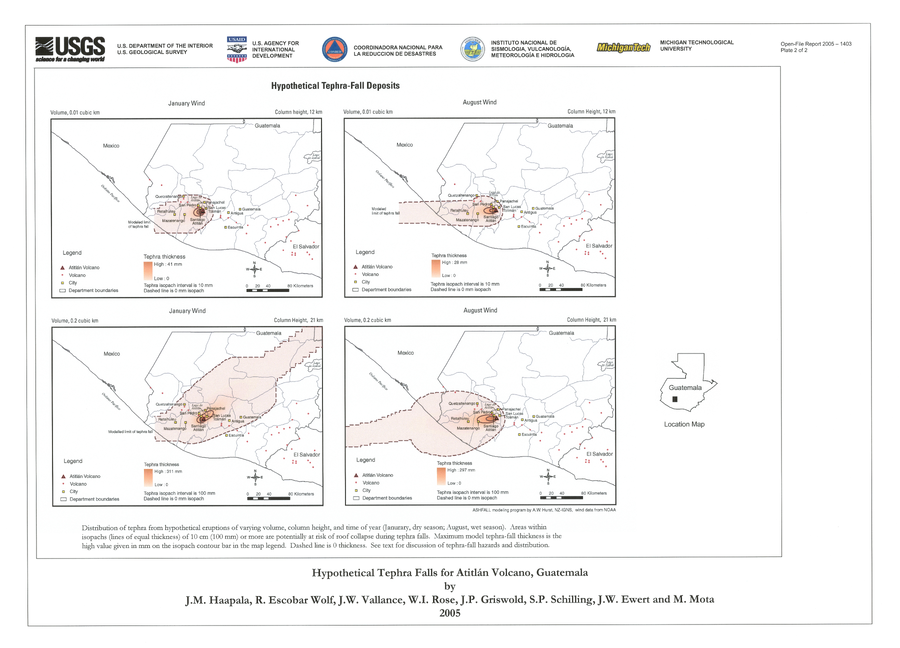
Official (foreign agency), Insert/poster-size map with accompanying report
Hypothetical Tephra-fall Deposits
Plate 2 in: Haapala, J. M., Escobar Wolf, R., Vallance, J. W., Rose, W. I., Griswold, J. P., Schilling, S. P., Ewert, J.W., & Mota, M. (2005). Volcanic hazards at Atitlan volcano, Guatemala. U.S. Geological Survey, Open-File Report, 1403. https://doi.org/10.3133/ofr20051403