
Advanced Search for Maps
Showing 51-60 of 528

Official, Flyer, brochure, short fact-sheet, or handout
Are You at Risk from the Next Eruption of Mount Hood? Hazards Zonation Map
Gardner, C. A., Scott, W. E., Major, J. J., & Pierson, T. C. (2000). Mount Hood-history and hazards of Oregon's most recently active volcano. US Geological Survey, Fact Sheet 060-00 (PDF Version). https://doi.org/10.3133/fs06000
Official, Figure in hazard assessment
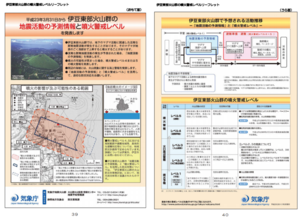
Area where the crater may appear and area where eruptions may affect
Page 18 in: Shizuoka Prefecture and Volcano Disaster Prevention Measure Deliberation Committee at Izu-Tobu Volcanoes. (2011). Volcano disaster prevention measure deliberation committee report at Izu-Tobu Volcanoes. Emergency Management Information Division, Shizuoka Prefecture.
Official, Figure in hazard assessment
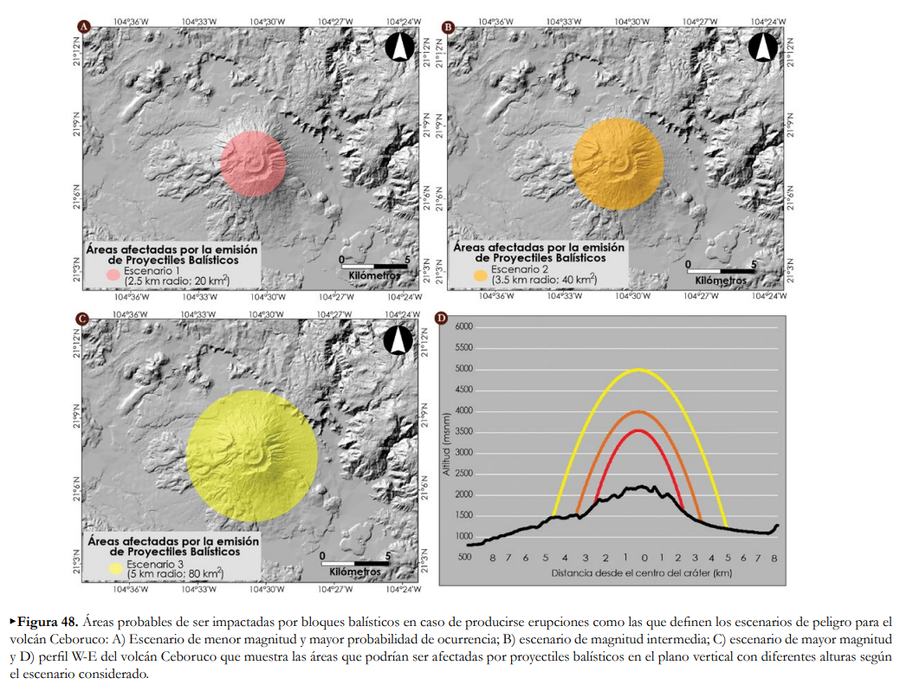
Áreas afectadas por la emisión de Proyectiles Balísticos
(Areas affected by the emission of Ballistic Projectiles)
Figure 48 in: Ferrés López, D., Sieron, K., González Zuccolotto, K., Constantinescu, R., Agustín Flores, J., Siebe Grabach, C., Capra Pedol, L., Connor, L., & Connor, C.B. (2019). Memoria técnica del mapa de peligros del volcán Ceboruco (Nayarit). Monografías del Instituto de Geofísica, 24.
Official, Figure in hazard assessment
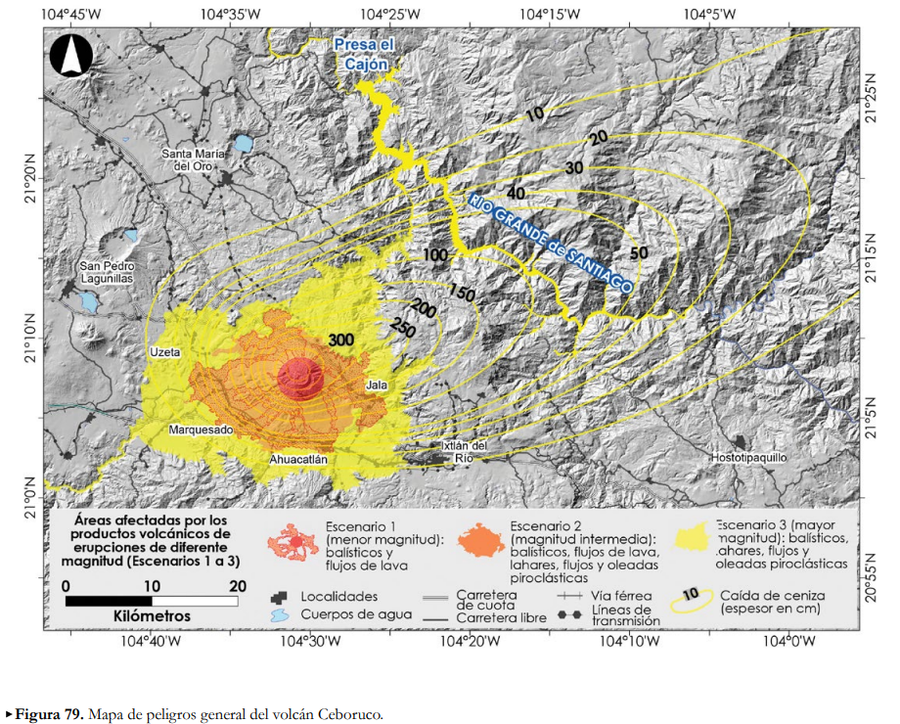
Áreas afectadas por los productos volcánicos de erupciones de diferente magntiud (Escenarios 1 a 3)
(Areas affected by the volcanic products of eruptions of different magnitudes (Scenarios 1 to 3))
Figure 79 in: Ferrés López, D., Sieron, K., González Zuccolotto, K., Constantinescu, R., Agustín Flores, J., Siebe Grabach, C., Capra Pedol, L., Connor, L., & Connor, C.B. (2019). Memoria técnica del mapa de peligros del volcán Ceboruco (Nayarit). Monografías del Instituto de Geofísica, 24.
Official, Figure in hazard assessment
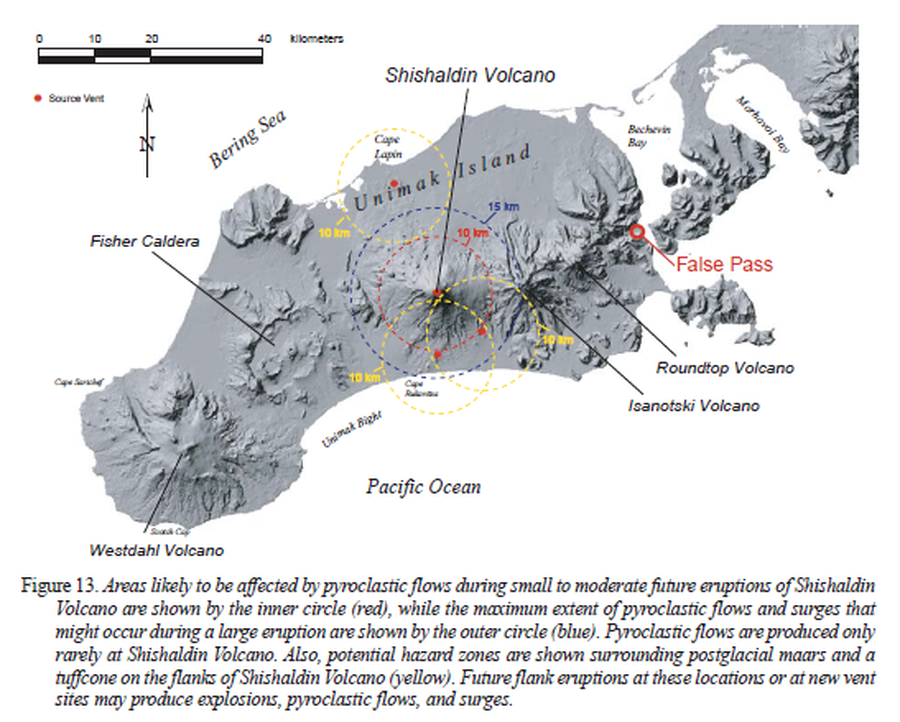
Areas likely to be affected by pyroclastic flows during small to moderate future eruptions of Shishaldin Volcano
Figure 13 in: Beget, J.E., Nye, C.J., Schaefer, J.R. & Stelling, P.L. (2003). Preliminary volcano-hazard assessment for Shishaldin Volcano, Alaska. Alaska Division of Geological & Geophysical Surveys, Report of Investigations 2002-4, 28 p., 1 sheet, scale 1:500,000. http://doi.org/10.14509/2872
Official, Insert/poster-size map with accompanying report
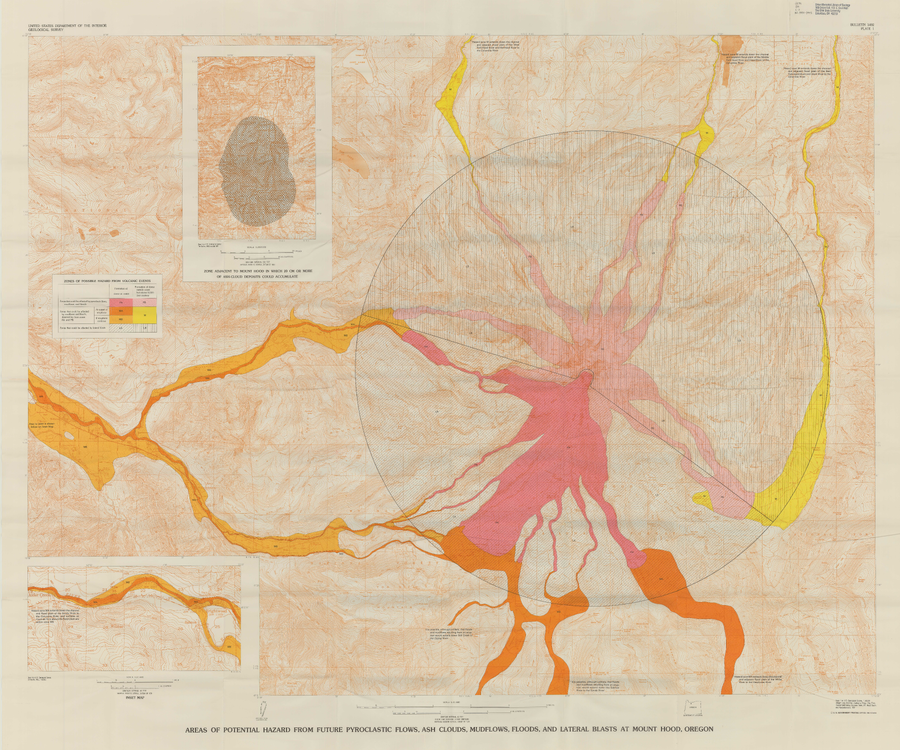
Areas of Potential Hazard from Future Pyroclastic Flows, Ash Clouds, Mudflows, and Lateral Blasts at Mount Hood, Oregon
Plate 1 in: Crandell, D.R. (1980). Recent eruptive history of Mount Hood, Oregon, and potential hazards from future eruptions. U.S. Geological Survey, Bulletin 1492, 81 p. https://doi.org/10.3133/b1492
Official, Figure in hazard assessment
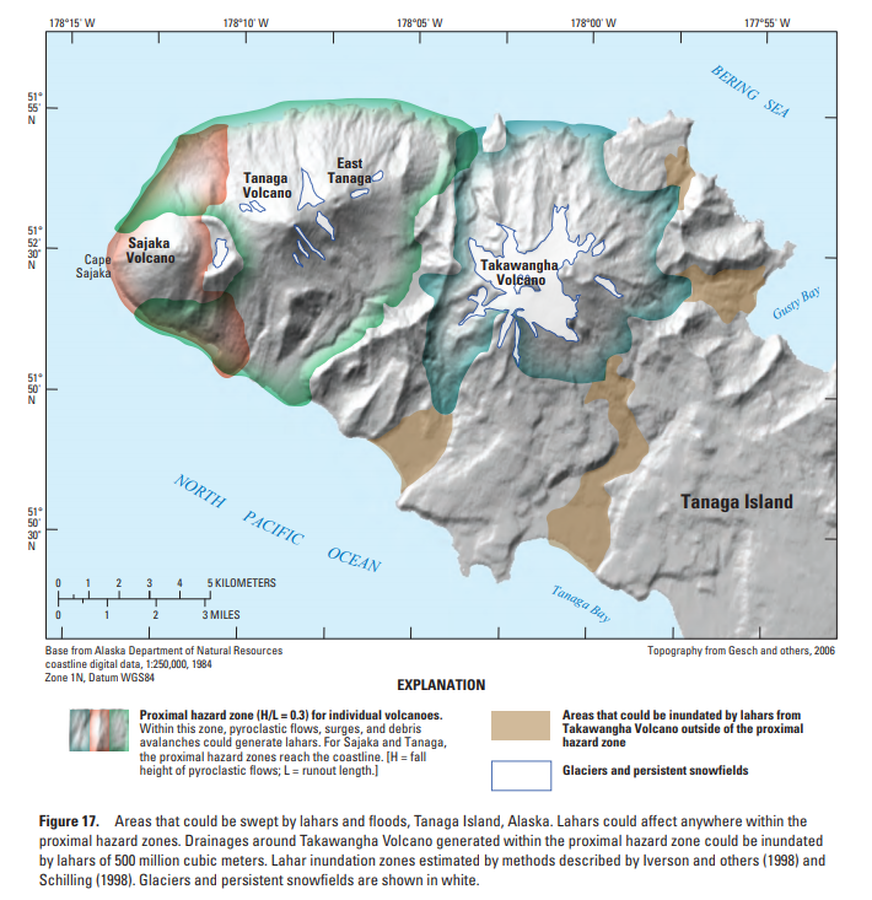
Areas that could be swept by lahars and floods, Tanaga Island, Alaska
Figure 17 in: Coombs, M.L., McGimsey, R.G. & Browne, B.L. (2007). Preliminary volcano-hazard assessment for the Tanaga volcanic cluster, Tanaga Island, Alaska. U.S. Geological Survey, Scientific Investigations Report 2007-5094, 41 p., 1 plate. https://doi.org/10.3133/sir20075094
Official, Figure in hazard assessment
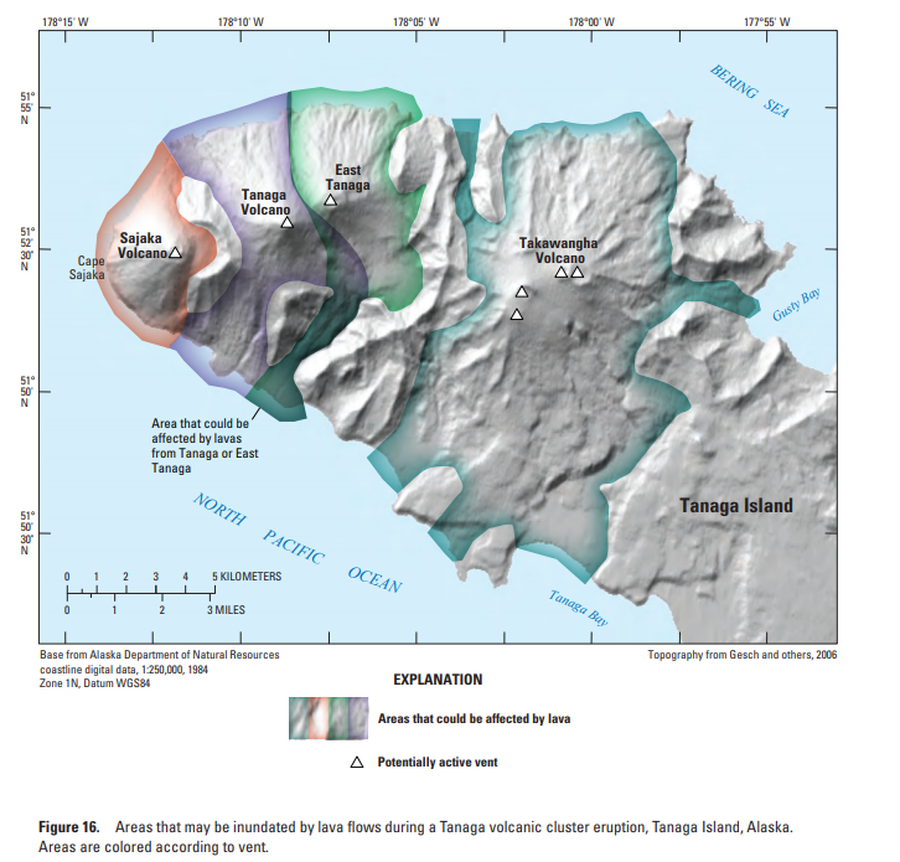
Areas that may be inundated by lava flows during a Tanaga volcanic cluster eruption, Tanaga Island, Alaska
Figure 16 in: Coombs, M.L., McGimsey, R.G. & Browne, B.L. (2007). Preliminary volcano-hazard assessment for the Tanaga volcanic cluster, Tanaga Island, Alaska. U.S. Geological Survey, Scientific Investigations Report 2007-5094, 41 p., 1 plate. https://doi.org/10.3133/sir20075094
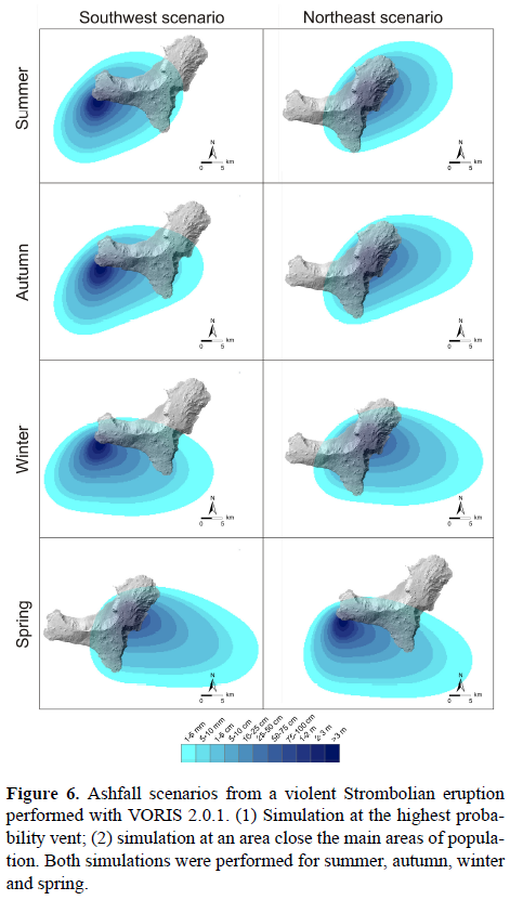
Figure in a journal article
Ashfall scenarios from a violent Strombolian eruption performed with VORIS 2.0.1.
Figure 6 in: Becerril, L., Bartolini, S., Sobradelo, R., Martí, J., Morales, J. M., & Galindo, I. (2014). Long-term volcanic hazard assessment on El Hierro (Canary Islands). Natural Hazards and Earth System Sciences, 14(7), 1853-1870. https://doi.org/10.5194/nhess-14-1853-2014, 2014
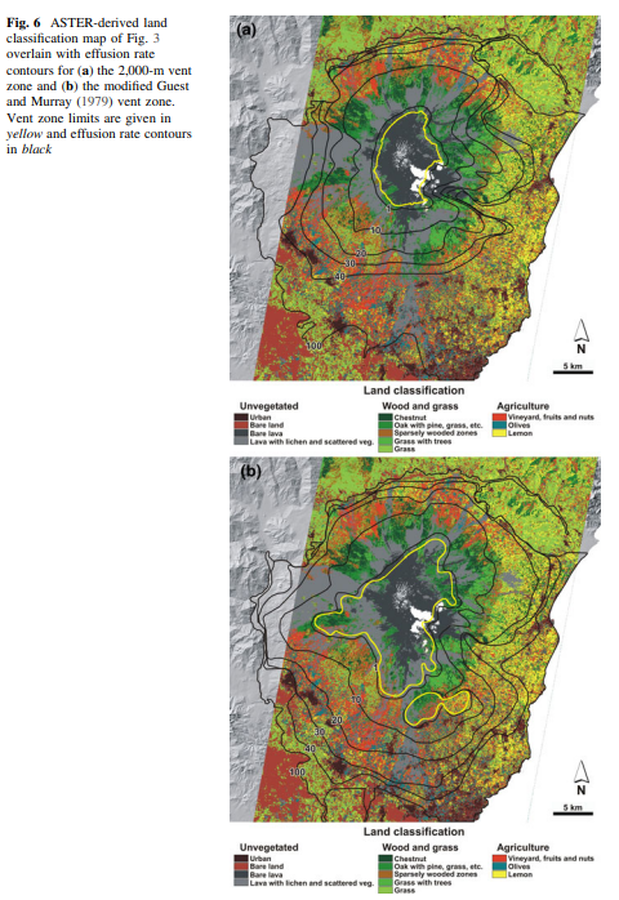
Figure in a journal article
ASTER-derived land classification map of Fig. 3 overlain with effusion rate contours for the 2,000-m vent zone and the modified Guest and Murray (1979) vent zone
Figure 6 in: Harris, A. J., Favalli, M., Wright, R., & Garbeil, H. (2011). Hazard assessment at Mount Etna using a hybrid lava flow inundation model and satellite-based land classification. Natural Hazards, 58(3), 1001-1027. https://doi.org/10.1007/s11069-010-9709-0