
Advanced Search for Maps
Showing 31-40 of 213
Holuhraun (Askja) & Bárdarbunga, Iceland
Official, Map in an information statement
Dæmi um verulegt sprengigos í Dyngjujökli, jafnþykktarlínur gjóskufalls
(Example of a major explosive eruption in Dyngjujökli, equal thickness lines of tephra)
Kort Jarðvísindastofnun HÍ. (2014). Dæmi um verulegt sprengigos í Dyngjujökli, jafnþykktarlínur gjóskufalls.

Figure in a journal article
Early simulations carried out before the onset of the effusive eruption
Figure 4 in: Tarquini, S., de'Michieli Vitturi, M., Jensen, E. H., Pedersen, G. B., Barsotti, S., Coppola, D., & Pfeffer, M. A. (2018). Modeling lava flow propagation over a flat landscape by using MrLavaLoba: the case of the 2014–2015 eruption at Holuhraun, Iceland. Annals of Geophysics. https://doi.org/10.4401/ag-7812
Official, Figure in hazard assessment
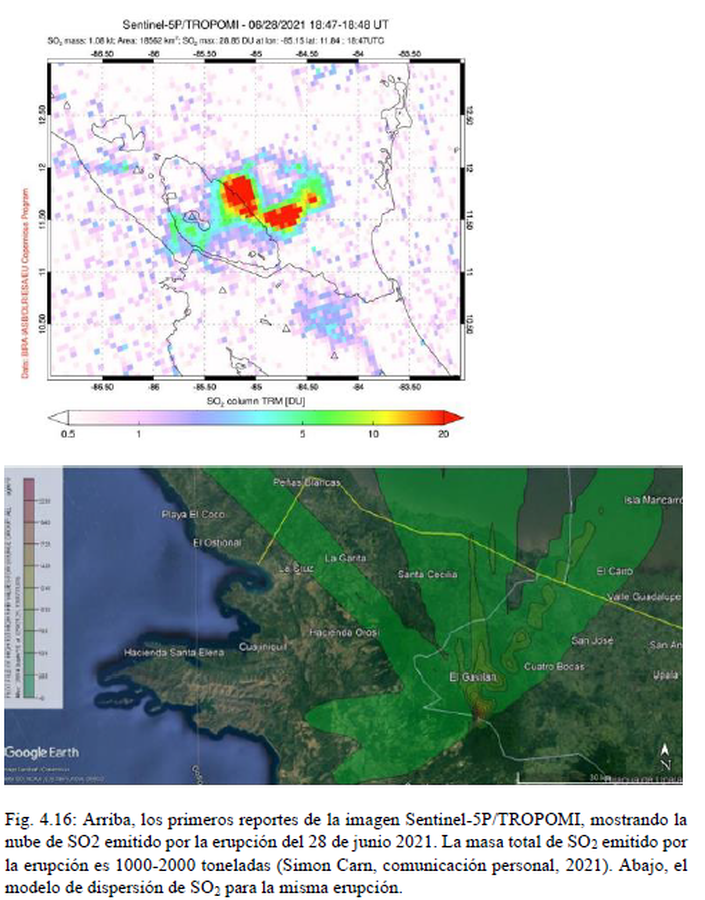
El modelo de dispersión de SO2 para la misma erupción
(The SO2 dispersion model for the same eruption)
Figure 4.16 in: Alvarado, G.E., Brenes-André, J., Venegas, L., Alpízar, Y., Núñez, S., Sánchez, M., Abarca, K., Abarca, J., Báez, W.A., Sibaja, J.P., Esquivel, L., & Arcia, T. (2022). Análisis del Peligro Volcánico del Rincón de la Vieja, Costa Rica. Instituto Costarricense de Electricidad (ICE). Setiembre 2022.
Official, Figure on website
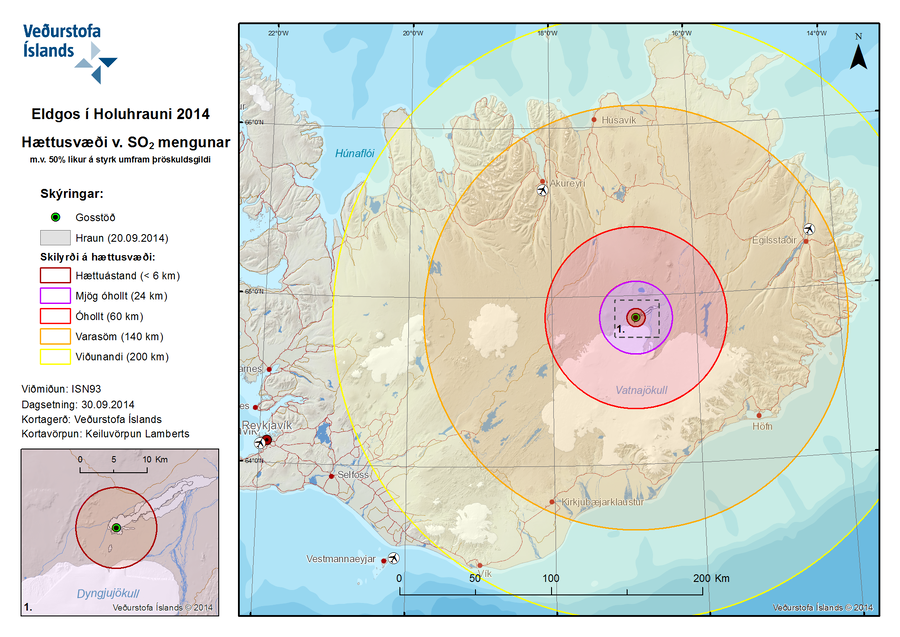
Eldgos í Holuhrauni 2014 Hættusvæði v. SO2 Mengunar m.v. 50% líkur á styrk umfram þröskuldsgildi
(Volcanic Eruption at Holuhraun 2014 Hazardous Area SO2 pollution 50% likelihood of concentration exceeding a threshold value)
Iceland Meteorological Office (IMO). (2014). Eldgos í Holuhrauni 2014 Hættusvæði v. SO2 Mengunar [Volcanic Eruption at Holuhraun 2014 Hazardous Area SO2 pollution]. (Reprinted in: Barsotti, S. (2015). Hazard Zoning: Probabilistic hazard maps of SO2 ground concentration for Holuhraun eruption. https://en.vedur.is/pollution-and-radiation/volcanic-gas/hazard-zoning/)

Official, Figure on website
Eldgos í Holuhrauni 2014 Hættusvæði v. SO2 Mengunar m.v. 90% líkur á styrk umfram þröskuldsgildi
(Volcanic Eruption at Holuhraun 2014 Hazardous Area SO2 pollution 90% likelihood of concentration exceeding a threshold value)
Iceland Meteorological Office (IMO). (2014). Eldgos í Holuhrauni 2014 Hættusvæði v. SO2 Mengunar [Volcanic Eruption at Holuhraun 2014 Hazardous Area SO2 pollution]. (Reprinted in: Barsotti, S. (2015). Hazard Zoning: Probabilistic hazard maps of SO2 ground concentration for Holuhraun eruption. https://en.vedur.is/pollution-and-radiation/volcanic-gas/hazard-zoning/)
Official, Figure on website
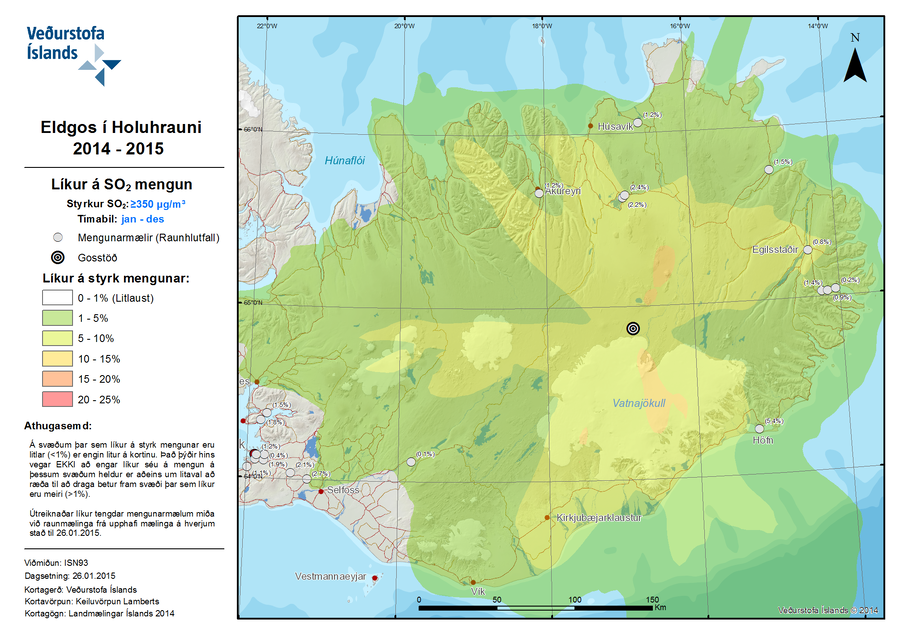
Eldgos í Holuhrauni 2014-2015 Líkur á SO2 Mengun
(Volcanic Eruption at Holuhraun 2014-2015 Probability of SO2 Contamination)
Iceland Meteorological Office (IMO). (2015). Eldgos í Holuhrauni 2014-2015 Líkur á SO2 Mengun [Volcanic Eruption at Holuhraun 2014-2015 Probability of SO2 Contamination]. (Reprinted in: Barsotti, S. (2015). Hazard Zoning: Probabilistic hazard maps of SO2 ground concentration for Holuhraun eruption. https://en.vedur.is/pollution-and-radiation/volcanic-gas/hazard-zoning/)
Official, Figure on website
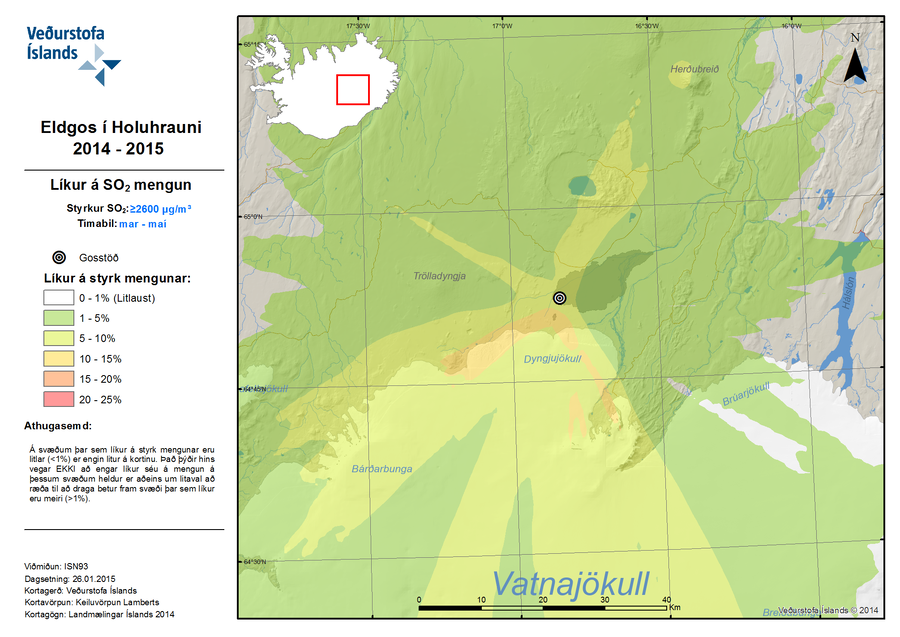
Eldgos í Holuhrauni 2014-2015 Líkur á SO2 Mengun
(Volcanic Eruption at Holuhraun 2014-2015 Probability of SO2 Contamination)
Iceland Meteorological Office (IMO). (2015). Eldgos í Holuhrauni 2014-2015 Líkur á SO2 Mengun [Volcanic Eruption at Holuhraun 2014-2015 Probability of SO2 Contamination]. (Reprinted in: Barsotti, S. (2015). Hazard Zoning: Probabilistic hazard maps of SO2 ground concentration for Holuhraun eruption. https://en.vedur.is/pollution-and-radiation/volcanic-gas/hazard-zoning/)
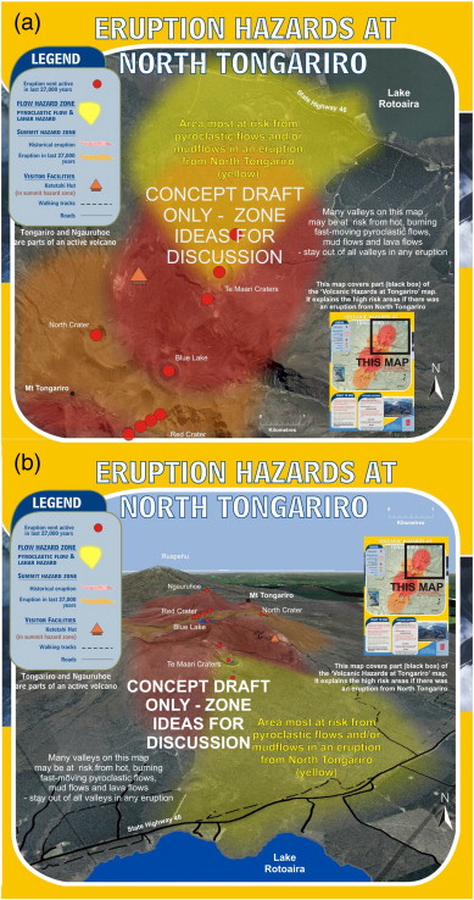
Official, Map sheet or poster
Eruption Hazards at North Tongariro
GNS Science (compiler). (2012). Te Maari Eruption Phenomena. Version 0.1, 6 August 2012. (Reprinted in: Leonard, G. S., Stewart, C., Wilson, T. M., Procter, J. N., Scott, B. J., Keys, H. J., Jolly, G.E., Wardman, J.B., Cronin. S.J. & McBride, S. K. (2014). Integrating multidisciplinary science, modelling and impact data into evolving, syn-event volcanic hazard mapping and communication: a case study from the 2012 Tongariro eruption crisis, New Zealand. Journal of Volcanology and Geothermal Research, 286, p. 208-232. https://doi.org/10.1016/j.jvolgeores.2014.08.018)
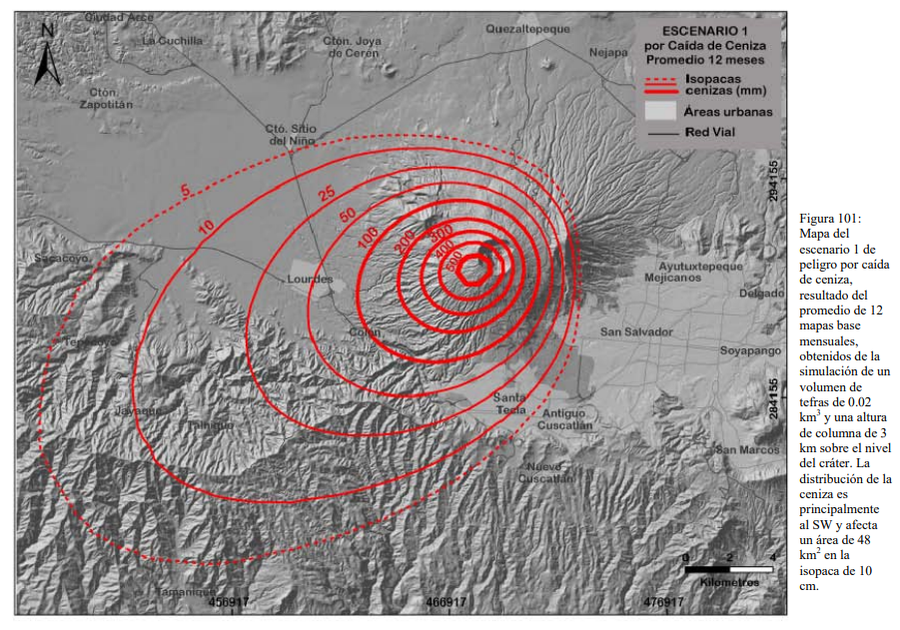
Figure in a thesis or dissertation
Escenario 1 por Caida de Ceniza Promedio 12 Meses
(Scenario 1 for Average Ash Fall 12 Months)
Figure 101 in: Ferrés López, M.D. (2014). Estratigrafía, Geología y Evaluación de Peligros Volcánicos del Complejo Volcánico de San Salvador (El Salvador). Doctoral Thesis, Universidad Autónoma de México, México.
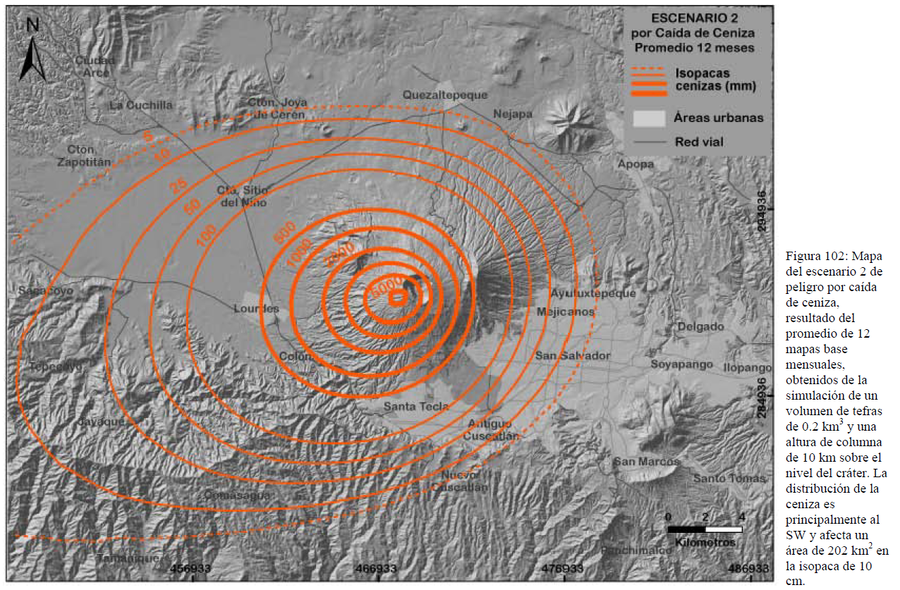
Figure in a thesis or dissertation
Escenario 2 por Caida de Ceniza Promedio 12 Meses
(Scenario 2 for Average Ash Fall 12 Months)
Figure 102 in: Ferrés López, M.D. (2014). Estratigrafía, Geología y Evaluación de Peligros Volcánicos del Complejo Volcánico de San Salvador (El Salvador). Doctoral Thesis, Universidad Autónoma de México, México.