
Advanced Search for Maps
Showing 451-460 of 2217

Official, Figure on website
Fancy Community Multi-Hazard Map
The University of the West Indies Seismic Research Centre (UWI-SRC) and National Emergency Management Organization (NEMO). (2021). Fancy Community Multi-Hazard Map. https://uwiseismic.com/wp-content/uploads/2021/10/Fancy-Hazard-Map-scaled.jpg
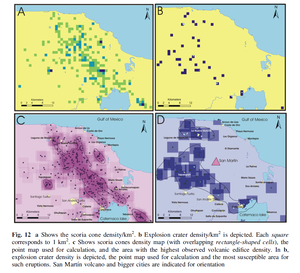
Figure in a journal article
Fig. 12 a Shows the scoria cone density/km². b Explosion crater density/km² is depicted. Each square corresponds to 1 km2. c Shows scoria cones density map (with overlapping rectangle-shaped cells), the point map used for calculation, and the area with the highest observed volcanic edifice density.
Figure 12 in: Sieron, K., Capra, L., & Rodríguez-Elizararrás, S. (2014). Hazard assessment at San Martín volcano based on geological record, numerical modeling, and spatial analysis. Natural hazards, 70(1), 275-297. https://doi.org/10.1007/s11069-013-0807-7
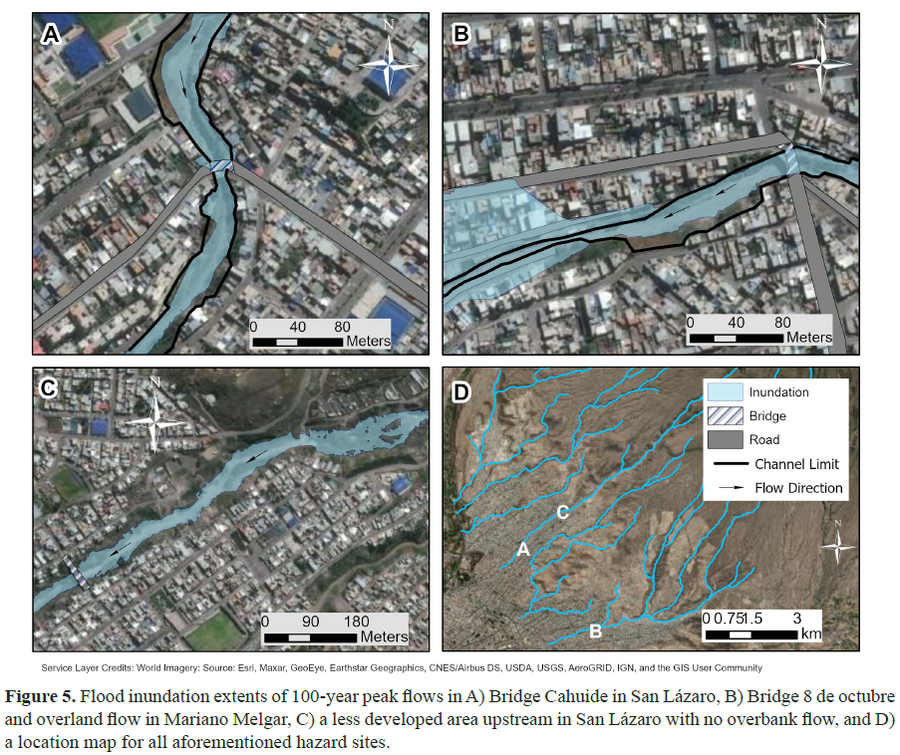
Figure in a journal article
Flood inundation extents of 100-year peak flows
Figure 5 in: Mazer, K. E., Tomasek, A. A., Daneshvar, F., Bowling, L. C., Frankenberger, J. R., McMillan, S. K., Novoa, H.M., & Zeballos‐Velarde, C. (2021). Integrated hydrologic and hydraulic analysis of torrential flood hazard in Arequipa, Peru. Journal of Contemporary Water Research & Education, 171(1), 93-110. https://doi.org/10.1111/j.1936-704X.2020.3347.x
Official, Figure in hazard assessment
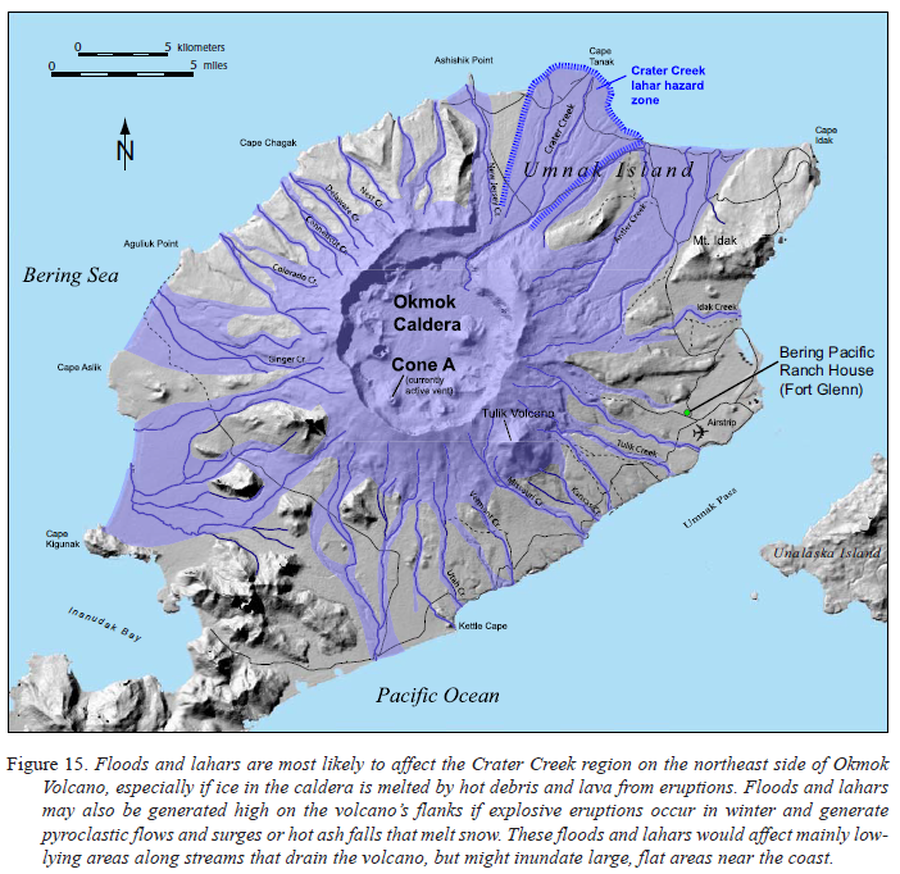
Floods and lahars are most likely to affect the Crater Creek region on the northeast side of Okmok Volcano
Figure 15 in: Beget, J.E., Larsen, J.F., Neal, C.A., Nye, C.J., & Schaefer, J.R. (2005). Preliminary volcano-hazard assessment for Okmok Volcano, Umnak Island, Alaska. Department of Natural Resources, Division of Geological & Geophysical Surveys (DGGS), Report of Investigation RI 2004-3, 32 p., 1 sheet, scale 1:150,000. http://doi.org/10.14509/7042
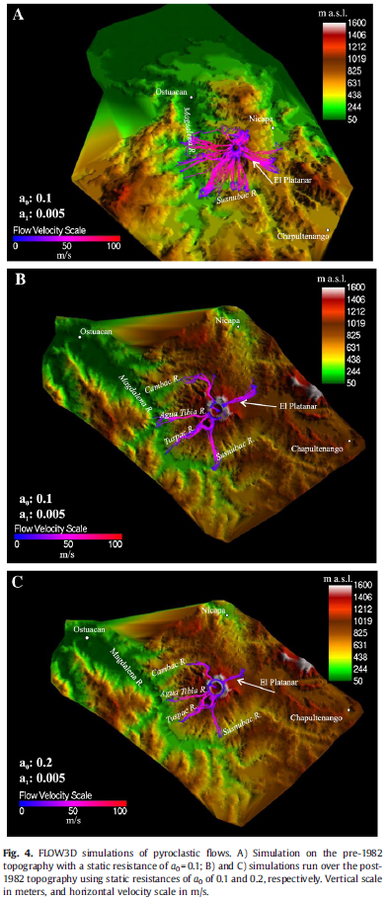
Figure in a journal article
FLOW3D simulations of pyroclastic flows
Figure 4 in: Macías, J. L., Capra, L., Arce, J. L., Espíndola, J. M., García-Palomo, A., & Sheridan, M. F. (2008). Hazard map of El Chichón volcano, Chiapas, México: Constraints posed by eruptive history and computer simulations. Journal of Volcanology and Geothermal Research, 175(4), 444-458. https://doi.org/10.1016/j.jvolgeores.2008.02.023
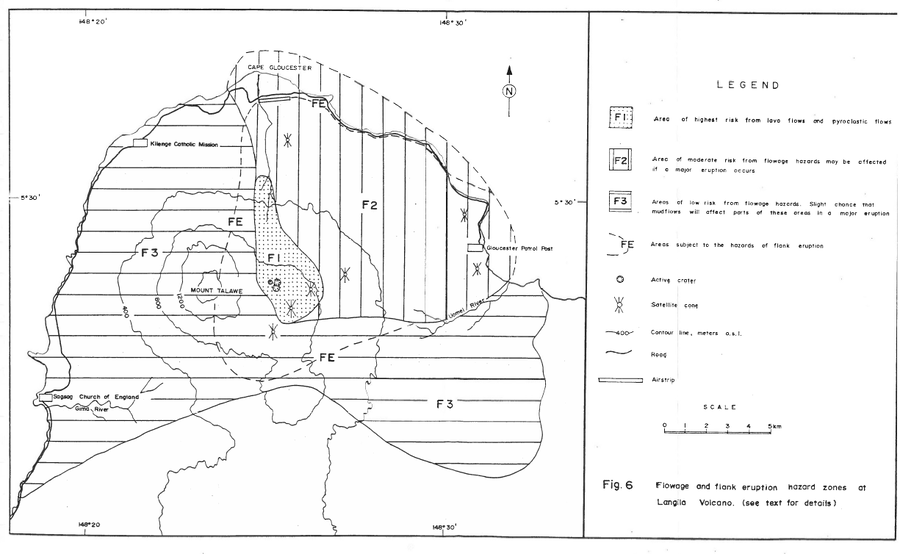
Official, Figure in hazard assessment
Flowage and flank eruption hazard zones at Langila Volcano
Figure 6 in: Talai, B. (1987). Volcanic hazards at Langila volcano. Geological Survey of Papua New Guinea, Report 87/25
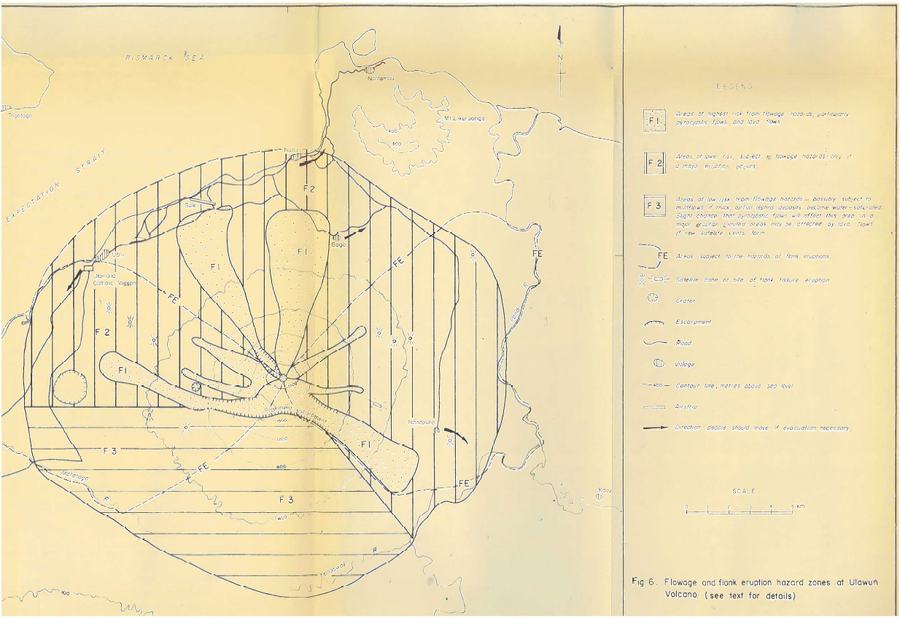
Official, Figure in hazard assessment
Flowage and flank eruption hazard zones at Ulawun Volcano
Figure 6 in: McKee, C.O. (1983). Volcanic hazards at Uluwan volcano. Geological Survey of Papua New Guinea, Report 83/13, 1:100,000
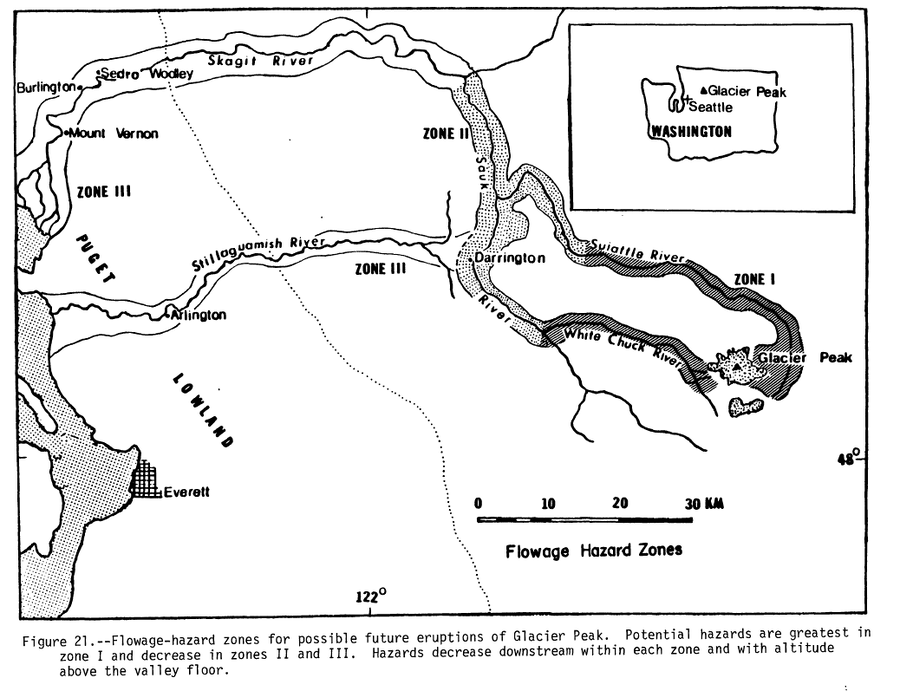
Official, Figure in hazard assessment
Flowage Hazard Zones
Figure 21 in: Beget, J.E. (1982). Postglacial Volcanic Deposits at Glacier Peak, Washington, and Potential Hazards from Future Eruptions. U.S. Geological Survey, Open-File Report 82-830, 81 p. https://doi.org/10.3133/ofr82830
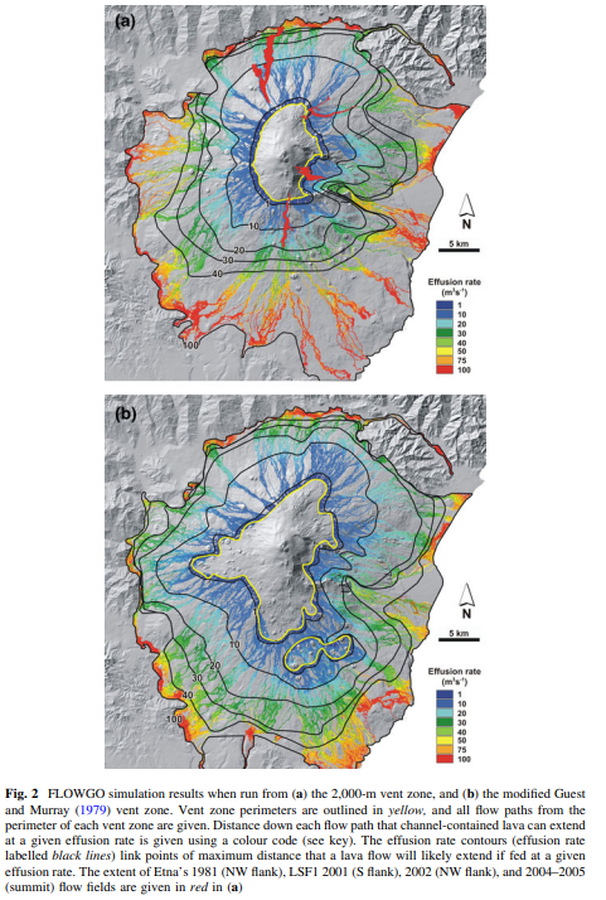
Figure in a journal article
FLOWGO simulation results when run from the 2,000-m vent zone, and the modified Guest and Murray (1979) vent zone.
Figure 2 in: Harris, A. J., Favalli, M., Wright, R., & Garbeil, H. (2011). Hazard assessment at Mount Etna using a hybrid lava flow inundation model and satellite-based land classification. Natural Hazards, 58(3), 1001-1027. https://doi.org/10.1007/s11069-010-9709-0
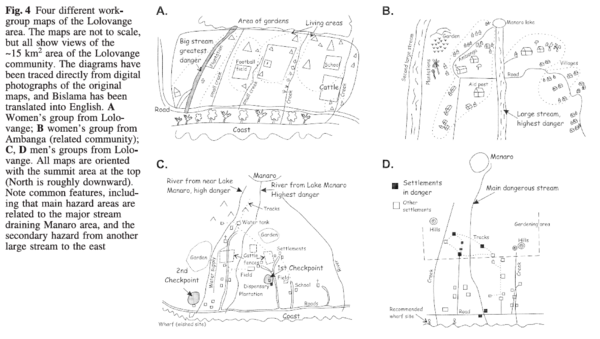
Figure in a journal article
Four different workgroup maps of the Lolovange area
Figure 4 in: Cronin, S.J., Gaylord, D.R., Charley, D., Alloway, B.V., Wallez, S., & Esau, J.W. (2004). Participatory methods of incorporating scientific with traditional knowledge for volcanic hazard management on Ambae Island, Vanuatu. Bulletin of volcanology, 66(7), p. 652-668. https://doi.org/10.1007/s00445-004-0347-9