
Advanced Search for Maps
Showing 1-10 of 77
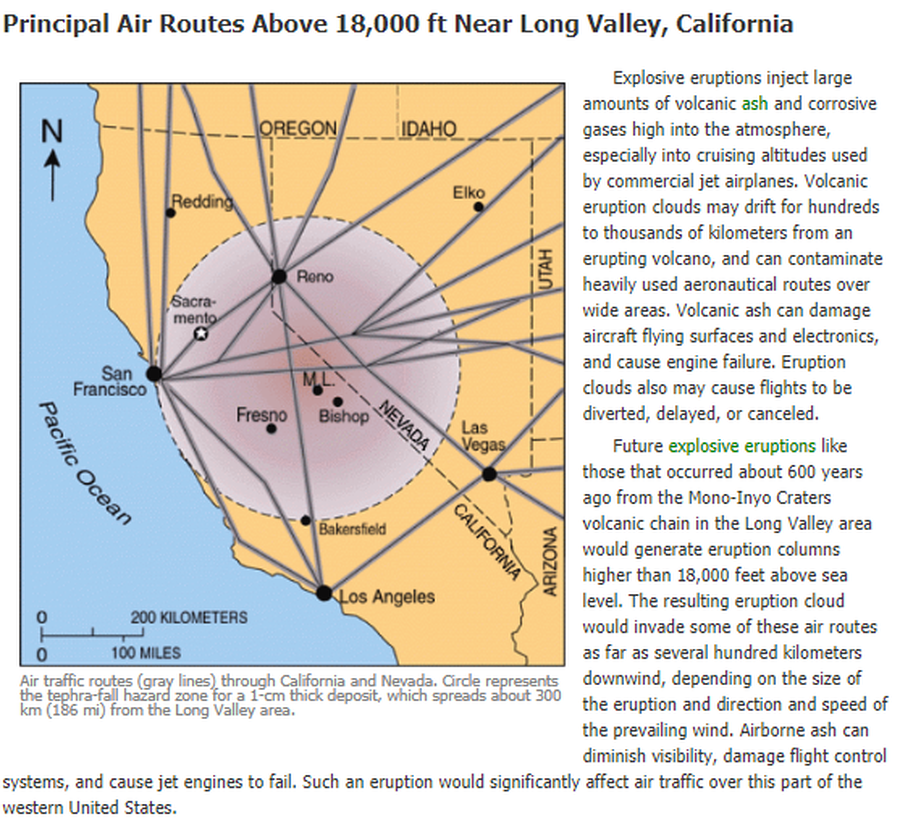
Official, Figure on website
Air traffic routes (gray lines) through California and Nevada. Circle represents the tephra-fall hazard zone for a 1-cm thick deposit, which spreads about 300 km (186 mi) from the Long Valley area.
U.S. Geological Survey (USGS). (2012). Air traffic routes (gray lines) through CA and Nevada. U.S. Geological Survey. Long Valley Caldera Hazards, Principal Air Routes Above 18,000 ft Near Long Valley, California. https://www.usgs.gov/volcanoes/long-valley-caldera/principal-air-routes-above-18000-ft-near-long-valley-california

Official, Figure on website
Ashfall model output for Yellowstone supereruption
U.S. Geological Survey (USGS). (2014). Ashfall model output for Yellowstone supereruption. U.S. Geological Survey. Modeling the Ash Distribution of a Yellowstone Supereruption (2014). https://www.usgs.gov/volcanoes/yellowstone/modeling-ash-distribution-yellowstone-supereruption-2014 (Simplified from: Mastin et al. 2014)
Soufrière St. Vincent, Saint Vincent and the Grenadines
Official, Figure on website
Chateaubelair & Fitz Hughes Community Multi-Hazard Map
The University of the West Indies Seismic Research Centre (UWI-SRC) and National Emergency Management Organization (NEMO). (2021). Chateaubelair & Fitz Hughes Community Multi-Hazard Map. https://uwiseismic.com/wp-content/uploads/2021/10/Chateau-fitzhughes_Hazard-Map-scaled.jpg
Official, Figure on website
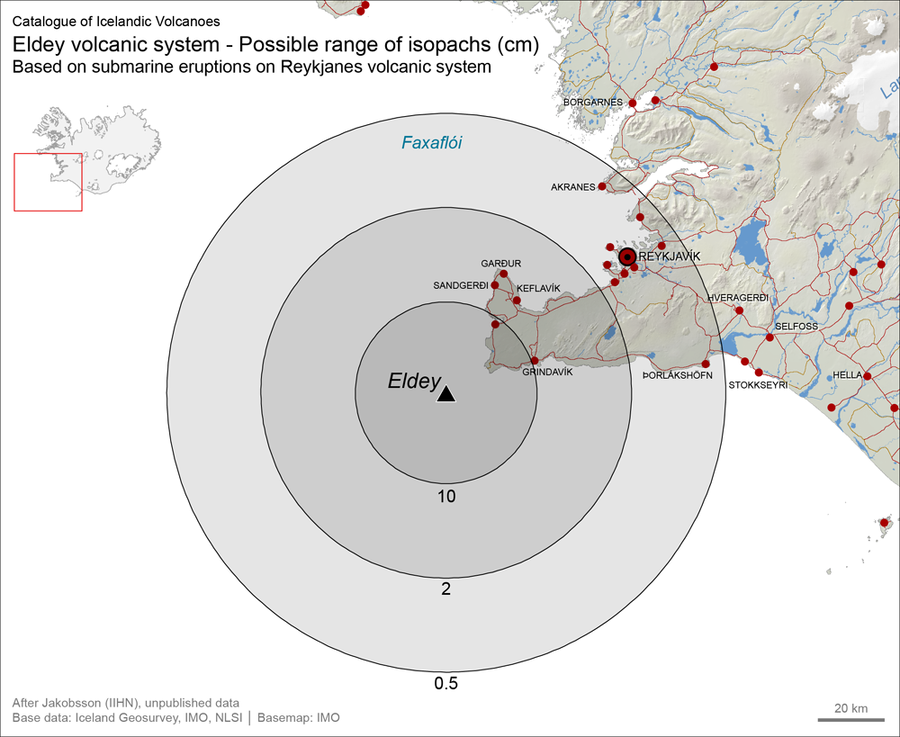
Eldey volcanic system - Possible range of isopachs (cm). Based on submarine eruptions on Reykjanes volcanic system
Larsen, G. (2019). Eldey. In: Oladottir, B., Larsen, G. & Guðmundsson, M. T. Catalogue of Icelandic Volcanoes. Iceland Meteorological Office (IMO), Univeristy of Iceland, and Civil Protection Department of the National Commissioner of the Iceland Police (CPD-NCIP). https://icelandicvolcanos.is//index.html (Simplified from: S.P. Jakobsson Unpublished data)
Official, Figure on website
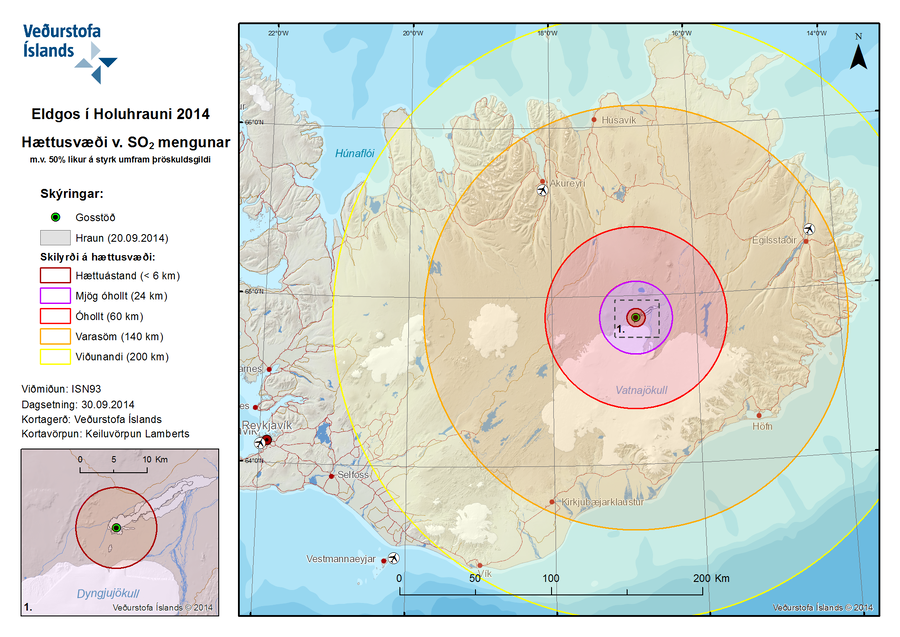
Eldgos í Holuhrauni 2014 Hættusvæði v. SO2 Mengunar m.v. 50% líkur á styrk umfram þröskuldsgildi
(Volcanic Eruption at Holuhraun 2014 Hazardous Area SO2 pollution 50% likelihood of concentration exceeding a threshold value)
Iceland Meteorological Office (IMO). (2014). Eldgos í Holuhrauni 2014 Hættusvæði v. SO2 Mengunar [Volcanic Eruption at Holuhraun 2014 Hazardous Area SO2 pollution]. (Reprinted in: Barsotti, S. (2015). Hazard Zoning: Probabilistic hazard maps of SO2 ground concentration for Holuhraun eruption. https://en.vedur.is/pollution-and-radiation/volcanic-gas/hazard-zoning/)

Official, Figure on website
Eldgos í Holuhrauni 2014 Hættusvæði v. SO2 Mengunar m.v. 90% líkur á styrk umfram þröskuldsgildi
(Volcanic Eruption at Holuhraun 2014 Hazardous Area SO2 pollution 90% likelihood of concentration exceeding a threshold value)
Iceland Meteorological Office (IMO). (2014). Eldgos í Holuhrauni 2014 Hættusvæði v. SO2 Mengunar [Volcanic Eruption at Holuhraun 2014 Hazardous Area SO2 pollution]. (Reprinted in: Barsotti, S. (2015). Hazard Zoning: Probabilistic hazard maps of SO2 ground concentration for Holuhraun eruption. https://en.vedur.is/pollution-and-radiation/volcanic-gas/hazard-zoning/)
Official, Figure on website
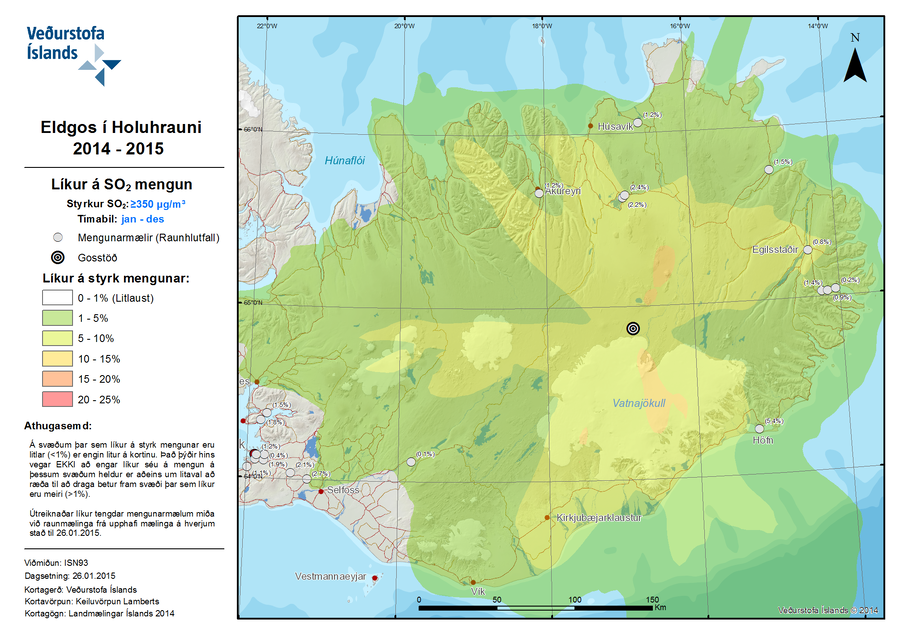
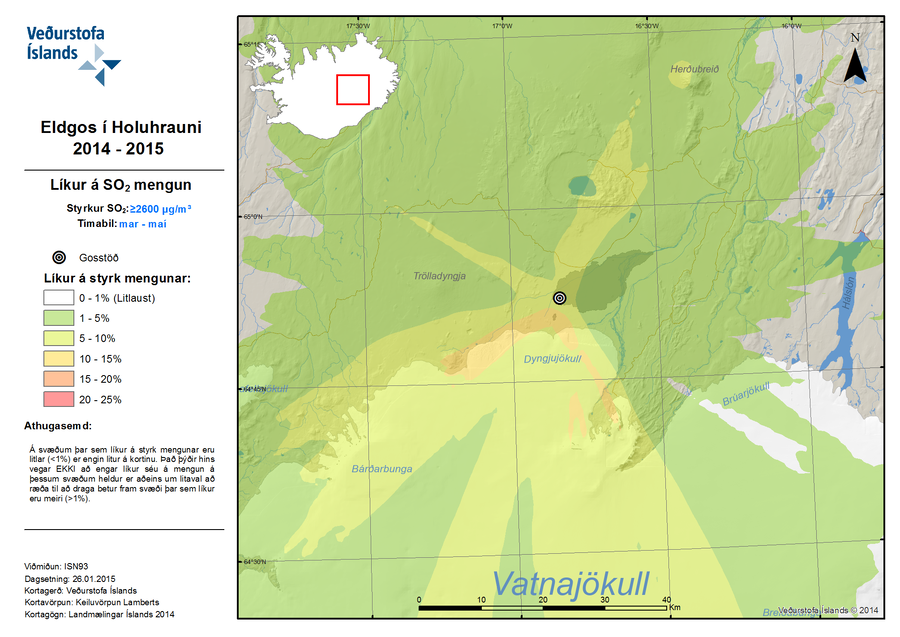
Eldgos í Holuhrauni 2014-2015 Líkur á SO2 Mengun
(Volcanic Eruption at Holuhraun 2014-2015 Probability of SO2 Contamination)
Iceland Meteorological Office (IMO). (2015). Eldgos í Holuhrauni 2014-2015 Líkur á SO2 Mengun [Volcanic Eruption at Holuhraun 2014-2015 Probability of SO2 Contamination]. (Reprinted in: Barsotti, S. (2015). Hazard Zoning: Probabilistic hazard maps of SO2 ground concentration for Holuhraun eruption. https://en.vedur.is/pollution-and-radiation/volcanic-gas/hazard-zoning/)
Official, Figure on website
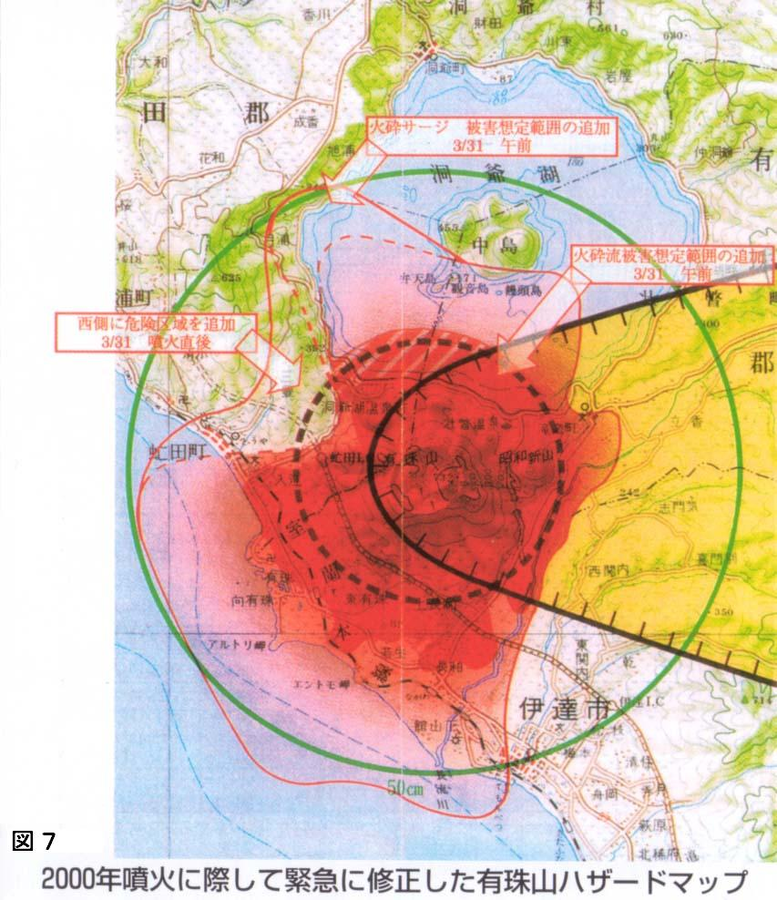
Emergency hazard map of Mt. usu revised after the 2000 eruption
Figure 7 in: Nakao, M. (2005). Eruption of Mt Usu, March 31 st 2000, at Mt Usu in Hokkaido. In: Failure Knowledge Database, 100 Selected Cases. http://www.shippai.org/fkd/en/cfen/CA1000619.html. Reprinted from: The Hokkaido Shimbun Press. (2002) 2000-Nen Usu-Zan Funka (The 2000 Mt. Usu Eruption). The Hokkaido Shimbun Press.
Soufrière St. Vincent, Saint Vincent and the Grenadines
Official, Figure on website
Fancy Community Multi-Hazard Map
The University of the West Indies Seismic Research Centre (UWI-SRC) and National Emergency Management Organization (NEMO). (2021). Fancy Community Multi-Hazard Map. https://uwiseismic.com/wp-content/uploads/2021/10/Fancy-Hazard-Map-scaled.jpg