
Advanced Search for Maps
Showing 531-540 of 2217
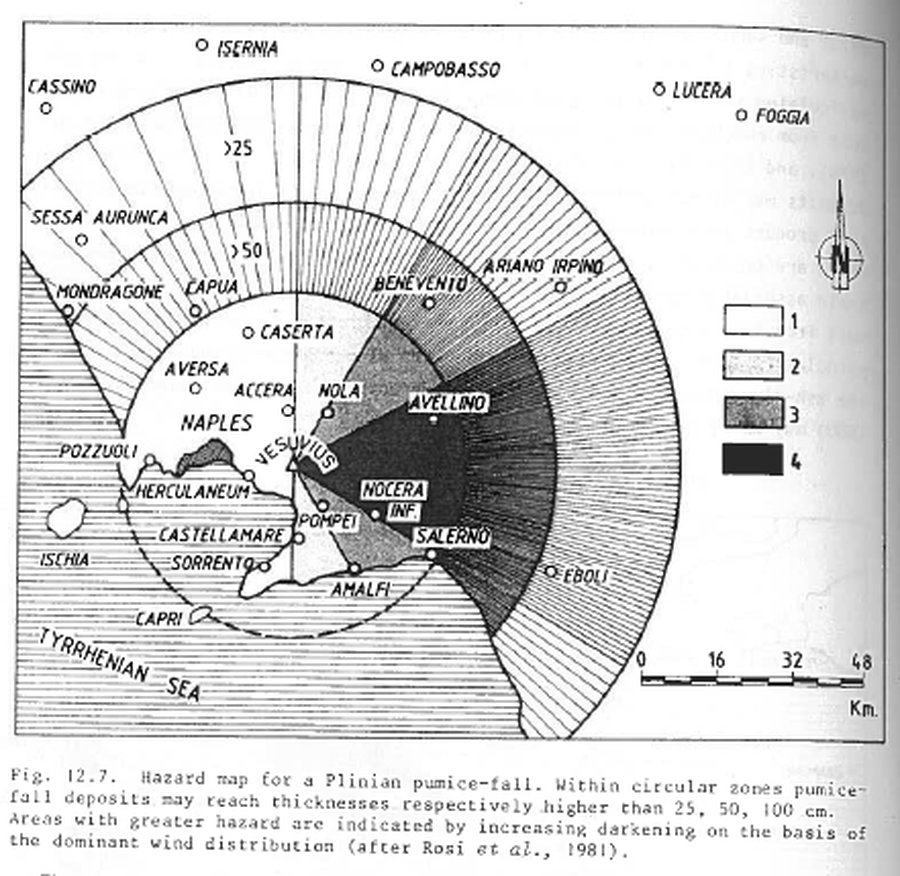
Figure in a journal article
Hazard map for a Plinian pumice-fall
Figure 12.7 in: Barberi, F., Rosi, M., Santacroce, R., & Sheridan, M.F. (1983). Volcanic hazard zonation: Mt. Vesuvius. In: Tazieff, H. & Sabroux, J.-C. (Eds.) Forecasting Volcanic Events, Elsevier, Amsterdam, p. 149-161.
Official, Figure in hazard assessment
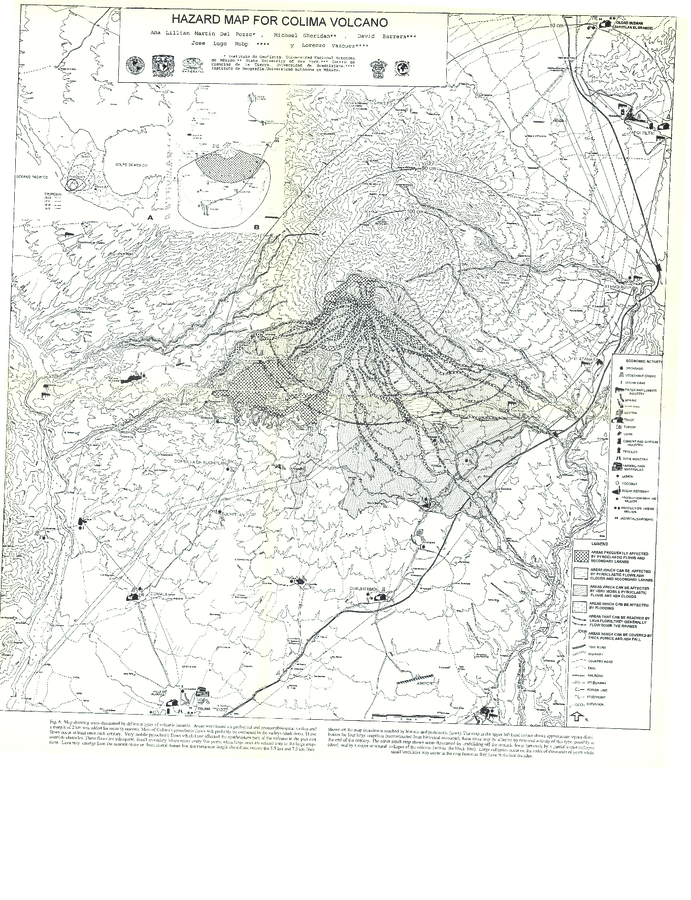
Hazard Map for Colima Volcano
Figure 6 in: Martin Del Pozzo, A. L., Sheridan, M., Barrera, D., Lugo Hubp, J., & Vázquez Selem, L. (1995). Potential hazards from Colima volcano, Mexico. Geofisica Internacional, 34(4), 363–376. Recuperado a partir de http://132.248.182.214/index.php/RGI/article/view/1422 (Modified version of: Martin Del Pozzo et al. 1995)
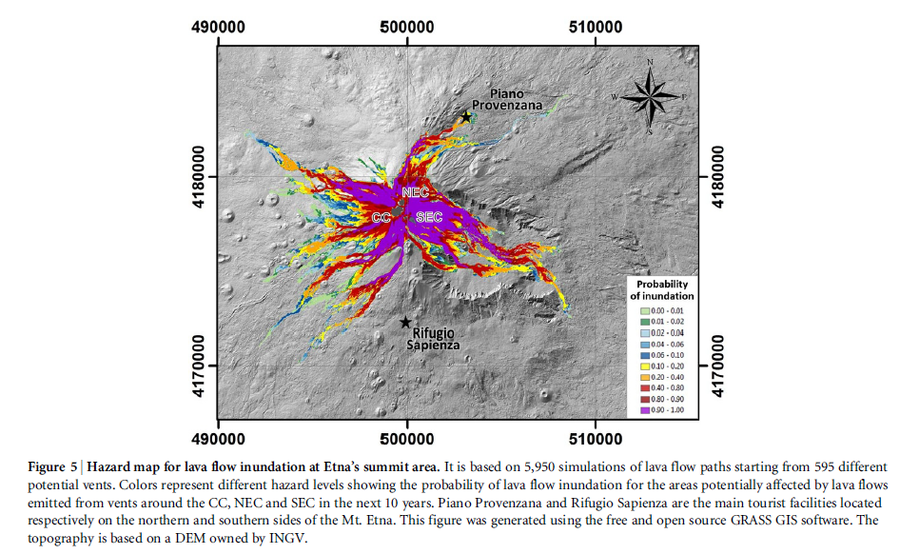
Figure in a journal article
Hazard map for lava flow inundation at Etna’s summit area.
Figure 5 in: Del Negro, C., Cappello, A., Neri, M., Bilotta, G., Hérault, A., & Ganci, G. (2013). Lava flow hazards at Mount Etna: constraints imposed by eruptive history and numerical simulations. Scientific Reports, 3(1). https://doi.org/10.1038/srep03493
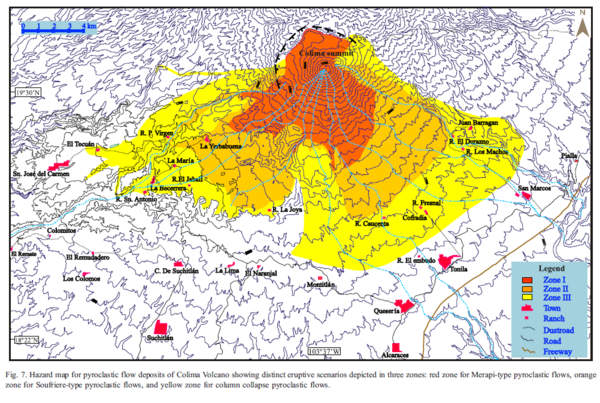
Figure in a journal article
Hazard map for pyroclastic flow deposits of Colima Volcano showing distinct eruptive scenarios depicted in three zones.
Figure 7 in: Saucedo, R., Macías, J.L., Sheridan, M.F., Bursik, M.I., & Komorowski, J.-C. (2005). Modeling of pyroclastic flows of Colima Volcano, Mexico: implications for hazard assessment. Journal of Volcanology and Geothermal Research, 139(1-2), p. 103-115. https://doi.org/10.1016/j.jvolgeores.2004.06.019
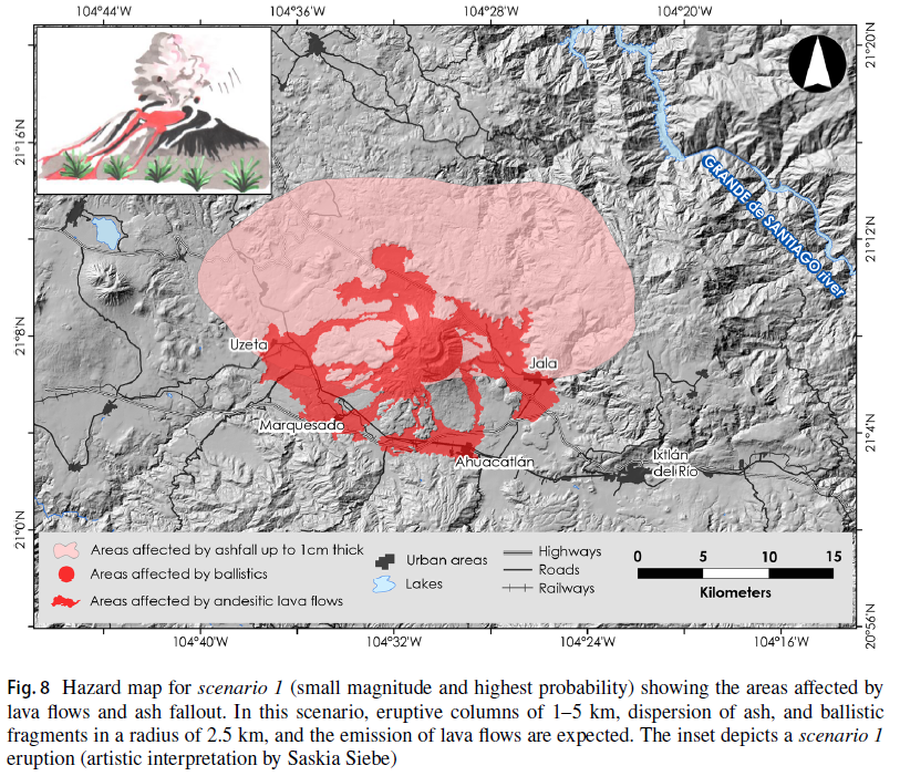
Figure in a journal article
Hazard map for scenario 1 (small magnitude and highest probability) showing the areas affected by lava flows and ash fallout
Figure 8 in: Sieron, K., Ferrés, D., Siebe, C., Constantinescu, R., Capra, L., Connor, C., Connor, L., Groppelli, G. & Zuccolotto, K.G. (2019). Ceboruco hazard map: part II—modeling volcanic phenomena and construction of the general hazard map. Natural Hazards, 96(2), p. 893-933. https://doi.org/10.1007/s11069-019-03577-5
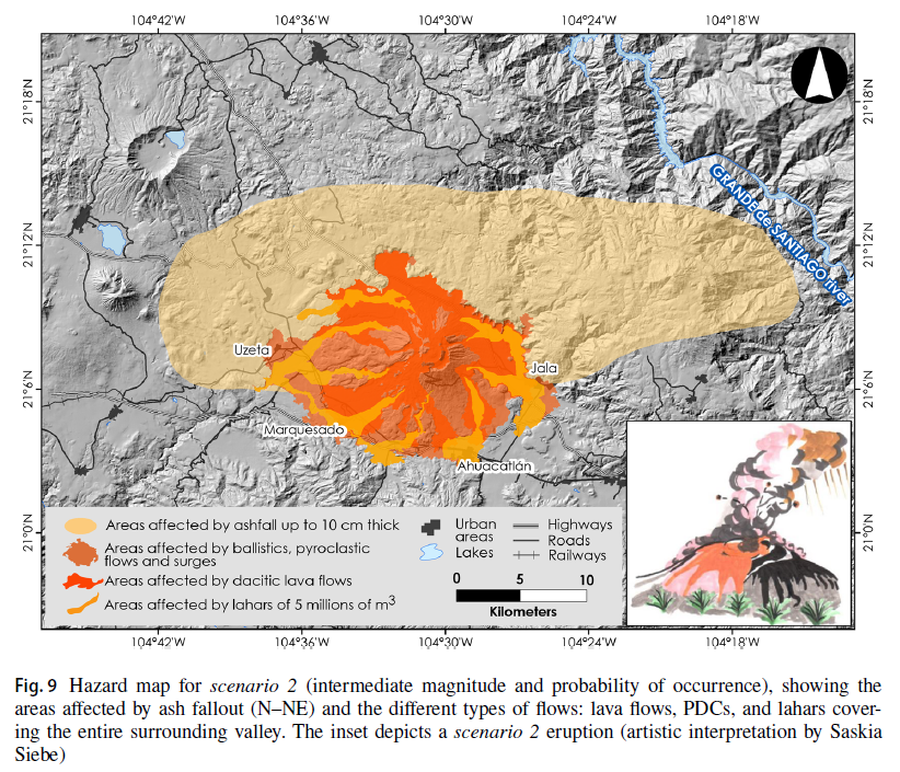
Figure in a journal article
Hazard map for scenario 2 (intermediate magnitude and probability of occurrence), showing the areas affected by ash fallout (N–NE) and the different types of flows: lava flows, PDCs, and lahars covering the entire surrounding valley
Figure 9 in: Sieron, K., Ferrés, D., Siebe, C., Constantinescu, R., Capra, L., Connor, C., Connor, L., Groppelli, G. & Zuccolotto, K.G. (2019). Ceboruco hazard map: part II—modeling volcanic phenomena and construction of the general hazard map. Natural Hazards, 96(2), p. 893-933. https://doi.org/10.1007/s11069-019-03577-5
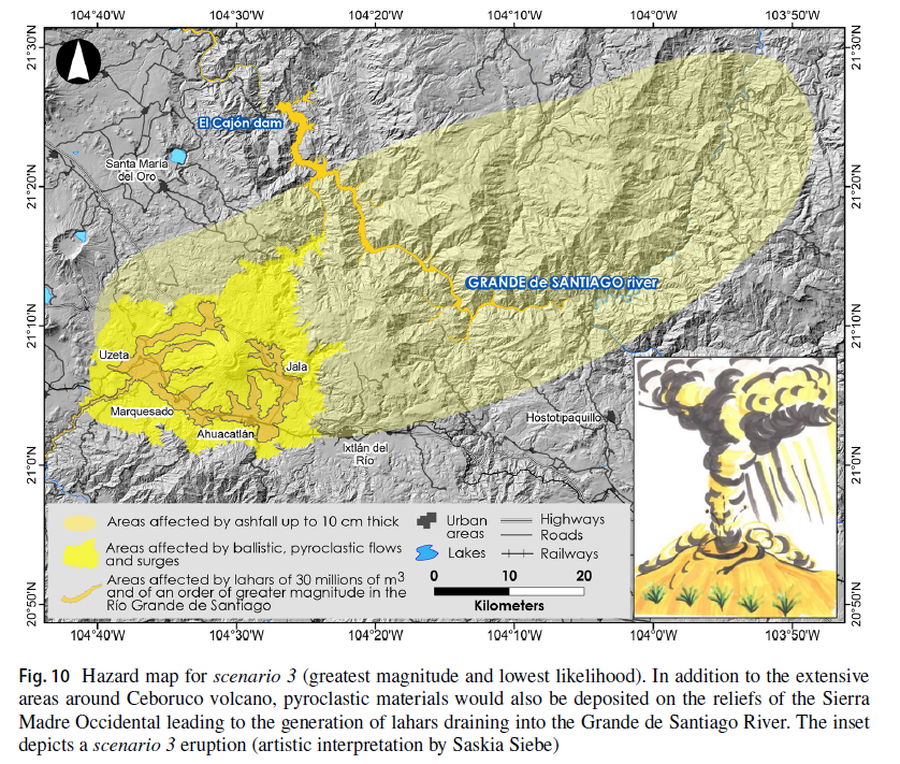
Figure in a journal article
Hazard map for scenario 3 (greatest magnitude and lowest likelihood)
Figure 10 in: Sieron, K., Ferrés, D., Siebe, C., Constantinescu, R., Capra, L., Connor, C., Connor, L., Groppelli, G. & Zuccolotto, K.G. (2019). Ceboruco hazard map: part II—modeling volcanic phenomena and construction of the general hazard map. Natural Hazards, 96(2), p. 893-933. https://doi.org/10.1007/s11069-019-03577-5
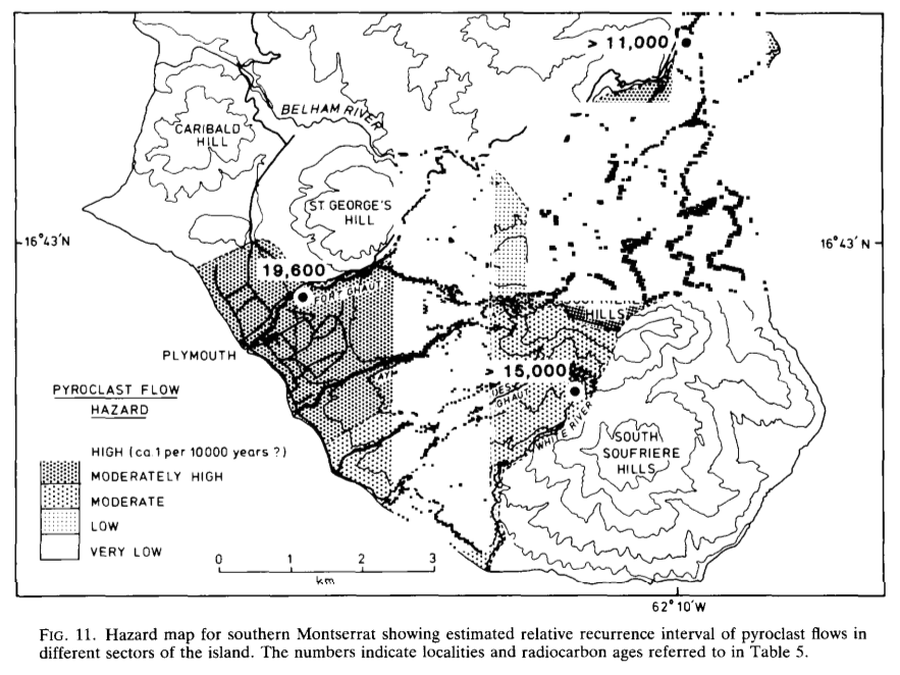
Figure in a journal article
Hazard map for southern Montserrat showing estimated relative recurrence interval of pyroclast flows in different sectors of the island
Figure 11 in: Baker, P. E. (1985). Volcanic hazards on St Kitts and Montserrat, West Indies. Journal of the Geological Society 142 (2): 279–295. https://doi.org/10.1144/gsjgs.142.2.0279
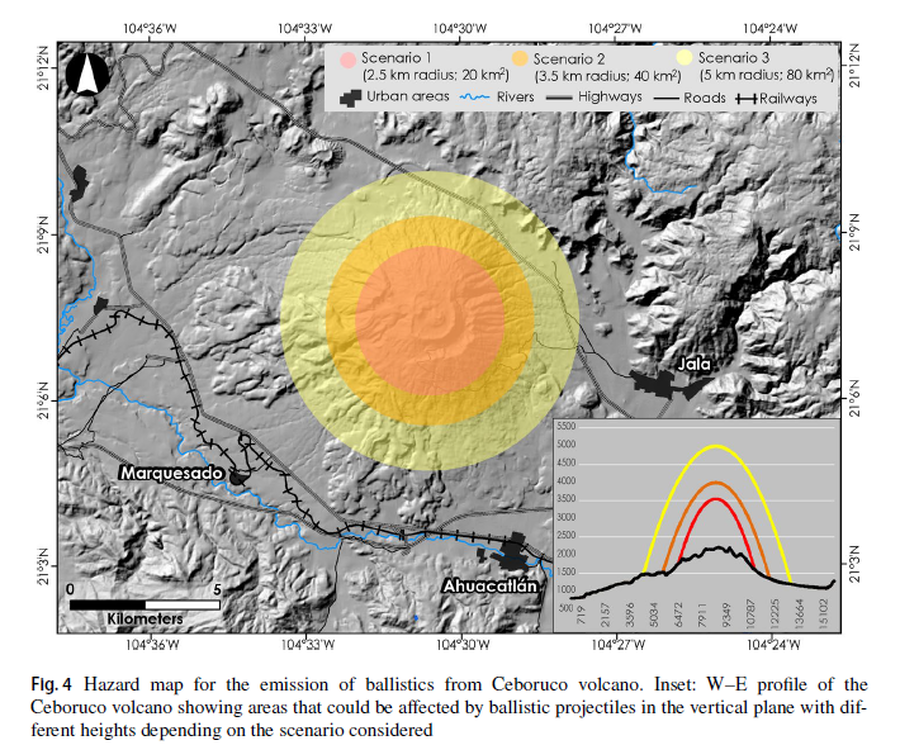
Figure in a journal article
Hazard map for the emission of ballistics from Ceboruco volcano
Figure 4 in: Sieron, K., Ferrés, D., Siebe, C., Constantinescu, R., Capra, L., Connor, C., Connor, L., Groppelli, G. & Zuccolotto, K.G. (2019). Ceboruco hazard map: part II—modeling volcanic phenomena and construction of the general hazard map. Natural Hazards, 96(2), p. 893-933. https://doi.org/10.1007/s11069-019-03577-5
Official, Map sheet or poster
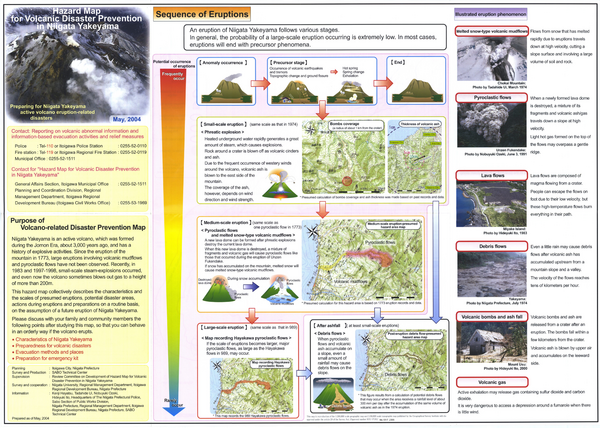
Hazard Map for Volcanic Disaster Prevention in Niigata Yakekama
Niigata Prefecture & Itoigawa City. (2004). Hazard Map for Volcanic Disaster Prevention in Niigata Yakayama.