
Advanced Search for Maps
Showing 791-800 of 2217
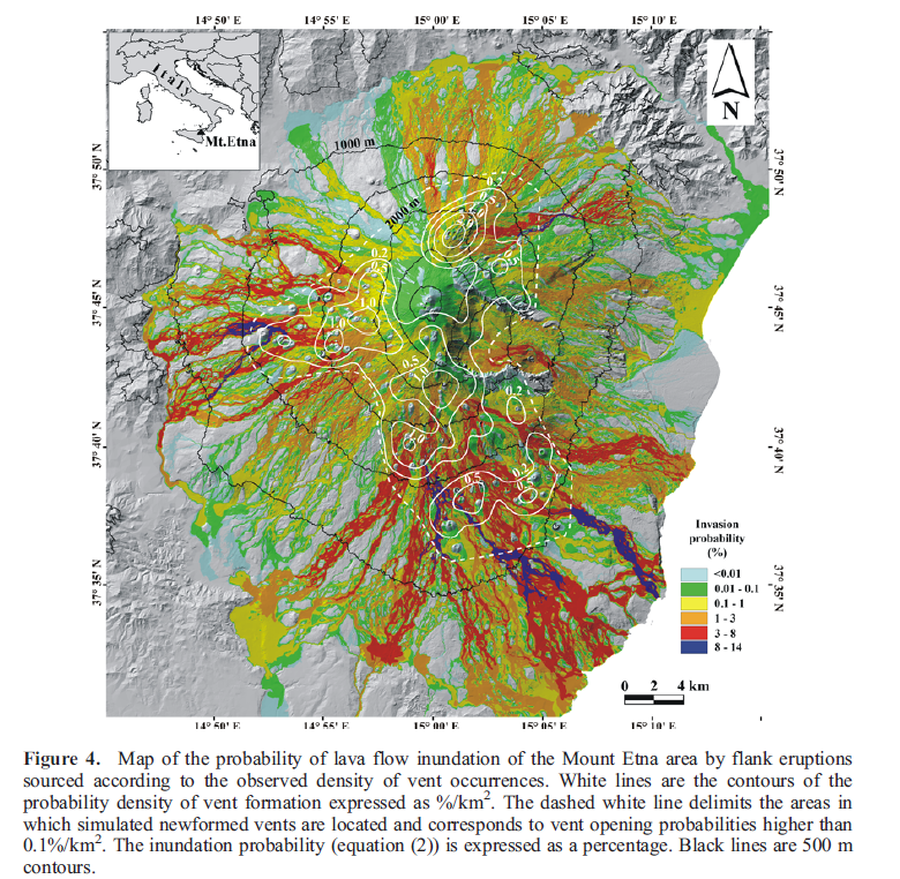
Figure in a journal article
Map of the probability of lava flow inundation of the Mount Etna area by flank eruptions sourced according to the observed density of vent occurrences
Figure 4 in: Favalli, M., Mazzarini, F., Pareschi, M. T., & Boschi, E. (2009). Topographic control on lava flow paths at Mount Etna, Italy: implications for hazard assessment. Journal of Geophysical Research: Earth Surface, 114(F1). https://doi.org/10.1029/2007JF000918
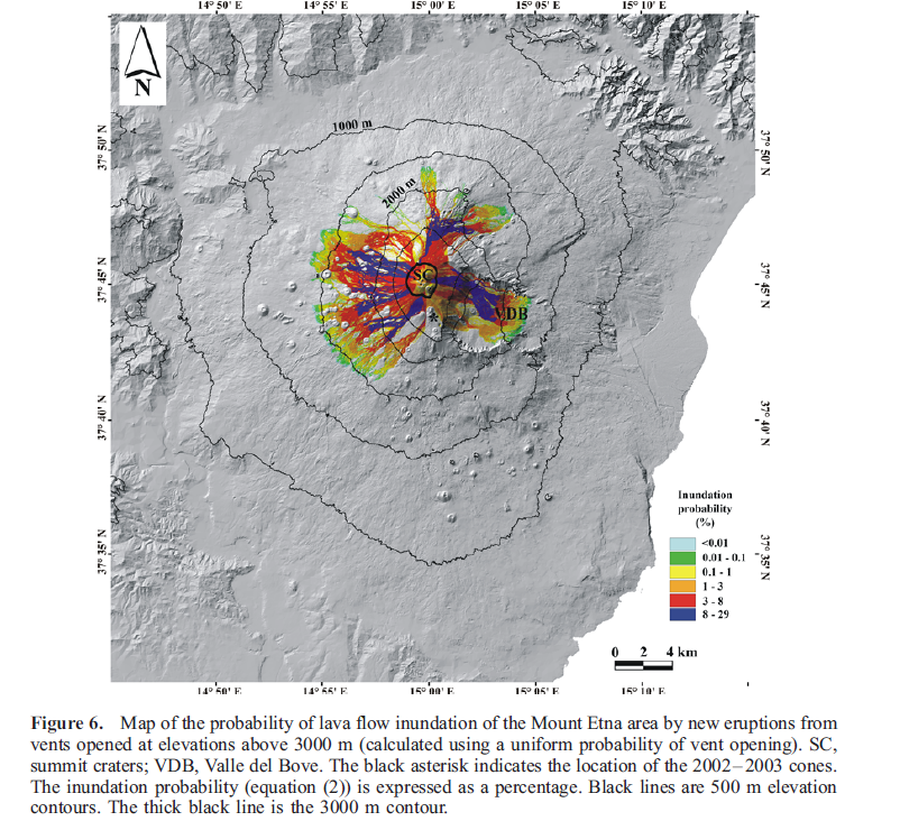
Figure in a journal article
Map of the probability of lava flow inundation of the Mount Etna area by new eruptions from vents opened at elevations above 3000 m (calculated using a uniform probability of vent opening)
Figure 6 in: Favalli, M., Mazzarini, F., Pareschi, M. T., & Boschi, E. (2009). Topographic control on lava flow paths at Mount Etna, Italy: implications for hazard assessment. Journal of Geophysical Research: Earth Surface, 114(F1). https://doi.org/10.1029/2007JF000918
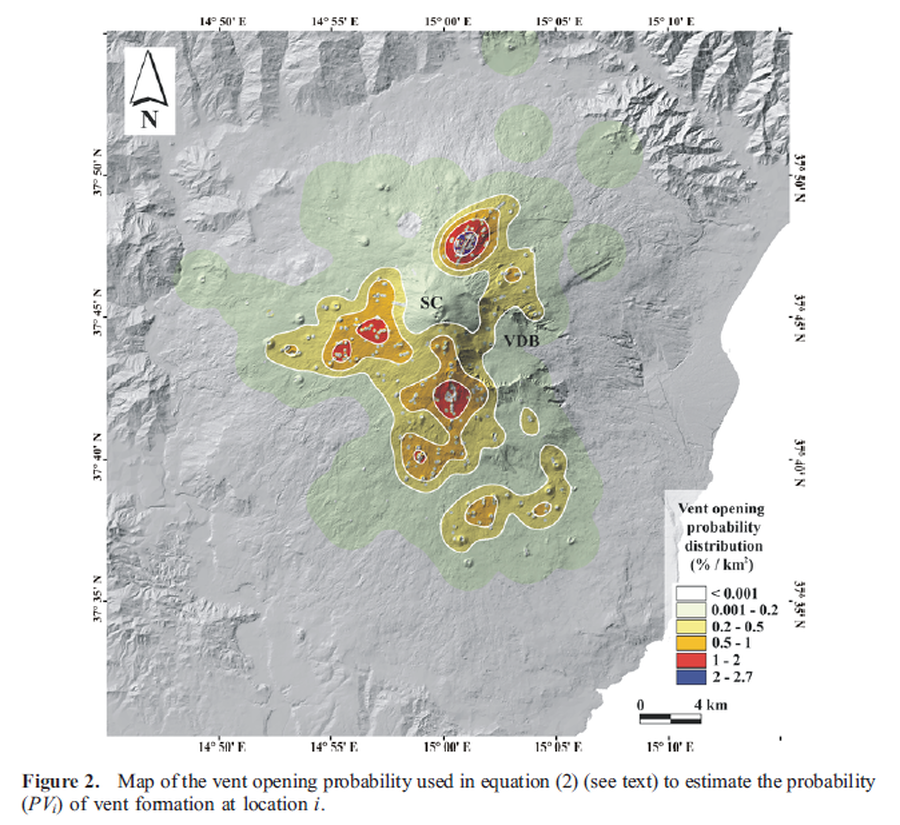
Figure in a journal article
Map of the vent opening probability
Figure 2 in: Favalli, M., Mazzarini, F., Pareschi, M. T., & Boschi, E. (2009). Topographic control on lava flow paths at Mount Etna, Italy: implications for hazard assessment. Journal of Geophysical Research: Earth Surface, 114(F1). https://doi.org/10.1029/2007JF000918
Map sheet or poster
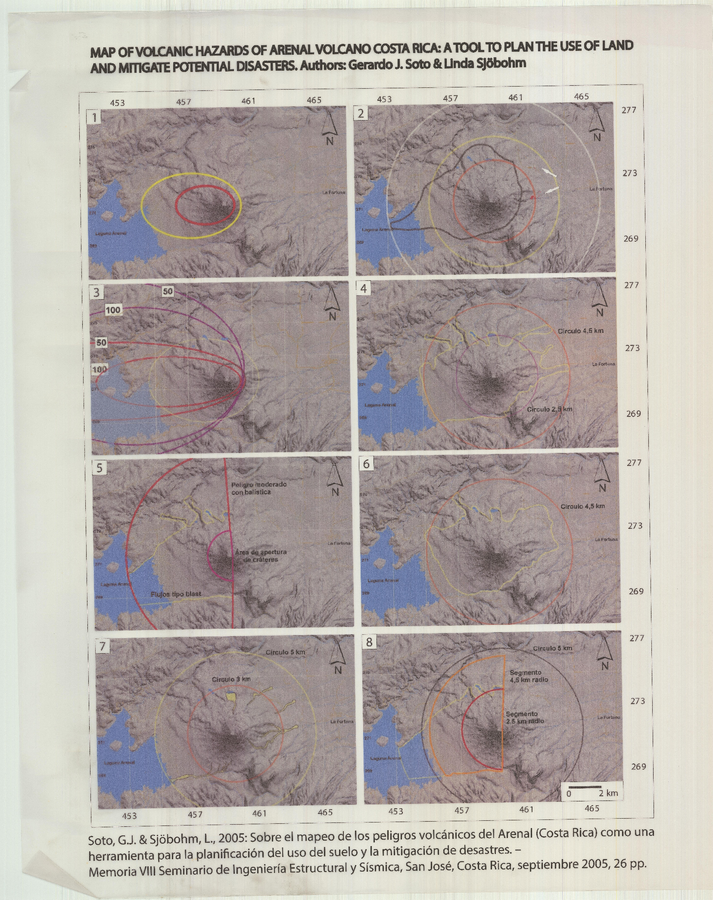
Map of Volcanic Hazards of Arenal Volcano Costa Rica: A Tool to Plan the Use of Land and Mitigate Potential Disasters
Soto, G.J. & Sjöbohm, L. (2005). Map of Volcanic Hazards of Arenal Volcano Costa Rica: A Tool to Plan the Use of Land and Mitigate Potential Disasters. (Modified from: Soto, G.J. & Sjöbohm, L. (2005). Sobre el mapeo de los peligros volcánicos del Arenal (Costa Rica) como una herramienta para la planificación del uso del suelo y la mitigación de desastres. Memoria VIII Seminario de Ingeniería Estructural y Sísmica, San José, Costa Rica, Septiembre 2005, 26 p.)
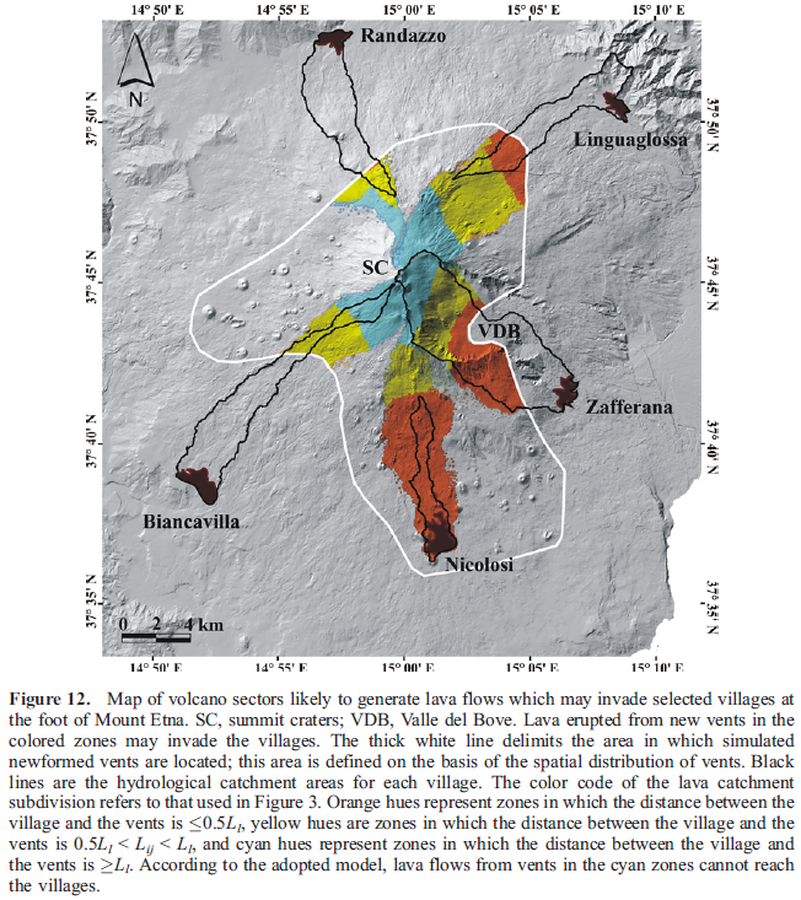
Figure in a journal article
Map of volcano sectors likely to generate lava flows which may invade selected villages at the foot of Mount Etna. SC, summit craters; VDB, Valle del Bove
Figure 12 in: Favalli, M., Mazzarini, F., Pareschi, M. T., & Boschi, E. (2009). Topographic control on lava flow paths at Mount Etna, Italy: implications for hazard assessment. Journal of Geophysical Research: Earth Surface, 114(F1). https://doi.org/10.1029/2007JF000918
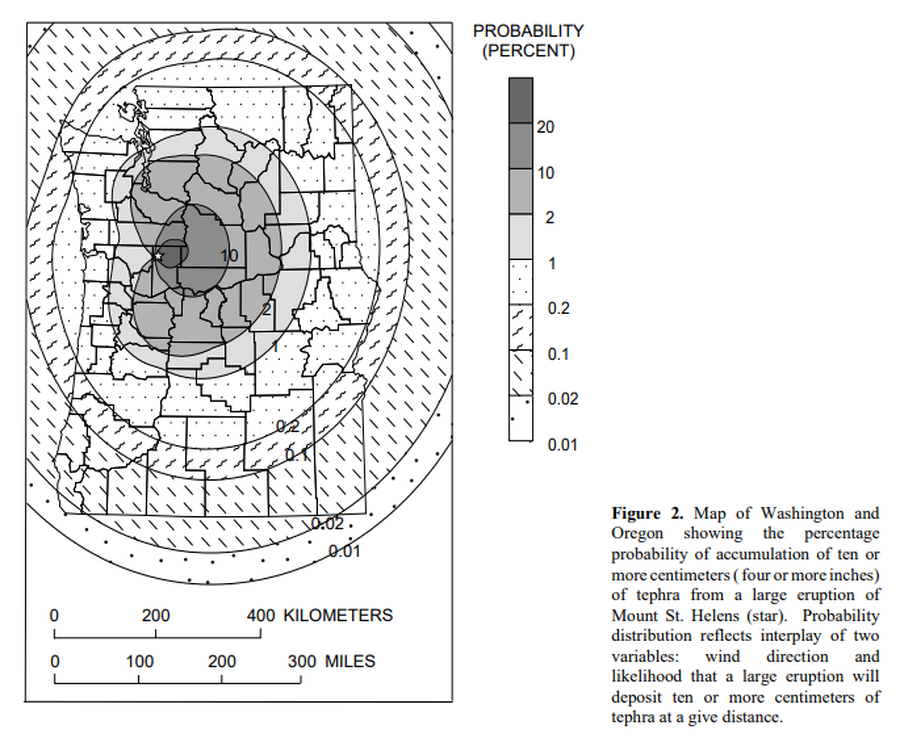
Official, Figure in hazard assessment
Map of Washington and Oregon showing the percentage probability of accumulation of ten or more centimeters (four or more inches) of tephra from a large eruptions of Mount St. Helens.
Figure 2 in: Wolfe, E.W. & Pierson, T.C. (1995). Volcanic-Hazard Zonation for Mount St. Helens, Washington, 1995. U.S. Geological Survey, Open-File Report 95-497, 12 p., 1 plate. https://doi.org/10.3133/ofr95497
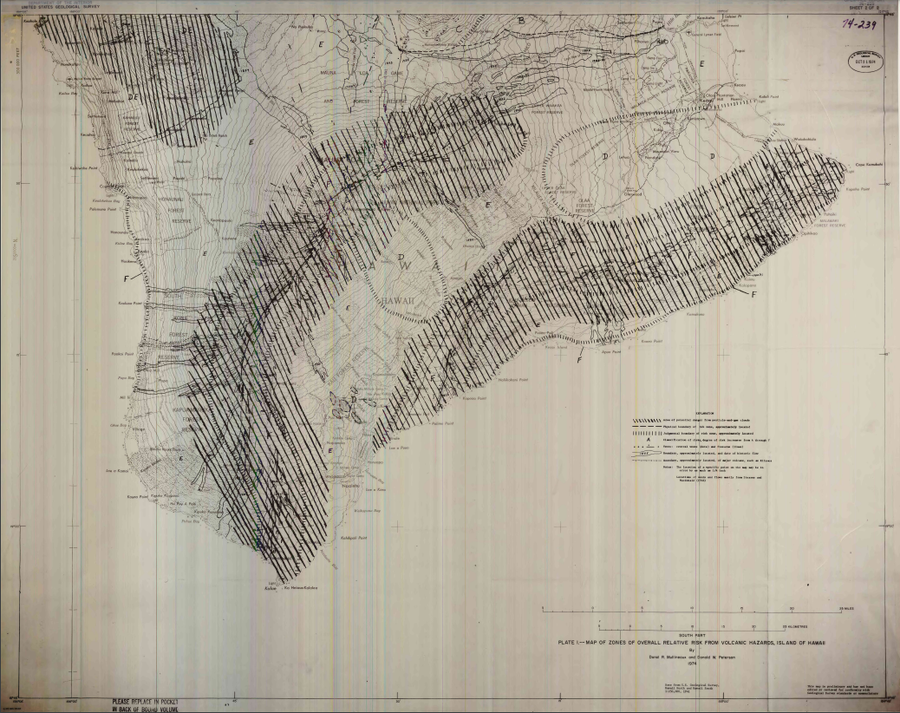
Official, Insert/poster-size map with accompanying report
Map of Zones of Overall Relative Risk From Volcanic Hazards, Island of Hawaii
Plate 1 in: Mullineaux, D.R. & Peterson, D.W. (1974). Volcanic hazards on the Island of Hawaii. U.S. Geological Survey, Open-File Report 74-239. https://doi.org/10.3133/ofr74239
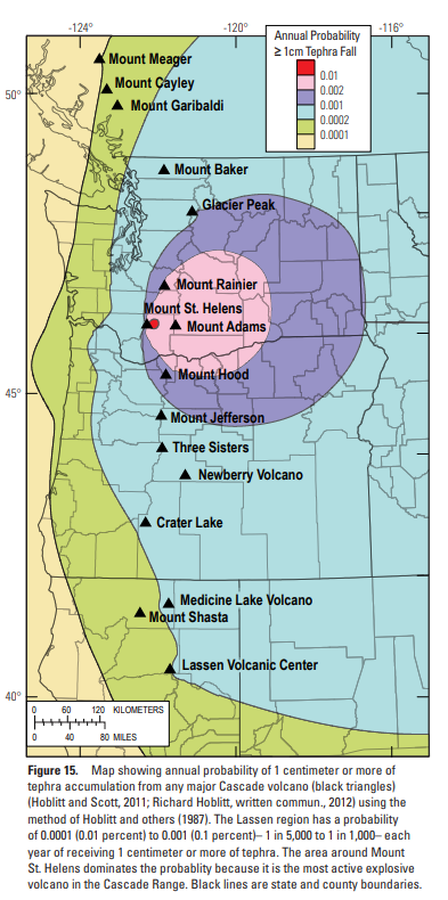
Official, Figure in hazard assessment
Map showing annual probability of 1 centimeter or more of tephra accumulation from any major Cascade volcano
Figure 15 in: Clynne, M. A., Robinson, J. E., Nathenson, M. & Muffler, L. P. (2012). Volcano hazards assessment for the Lassen region, northern California. U.S. Geological Survey, Scientific Investigations Report 2012-5176-A, 47 p., 1 plate. https://doi.org/10.3133/sir20125176A
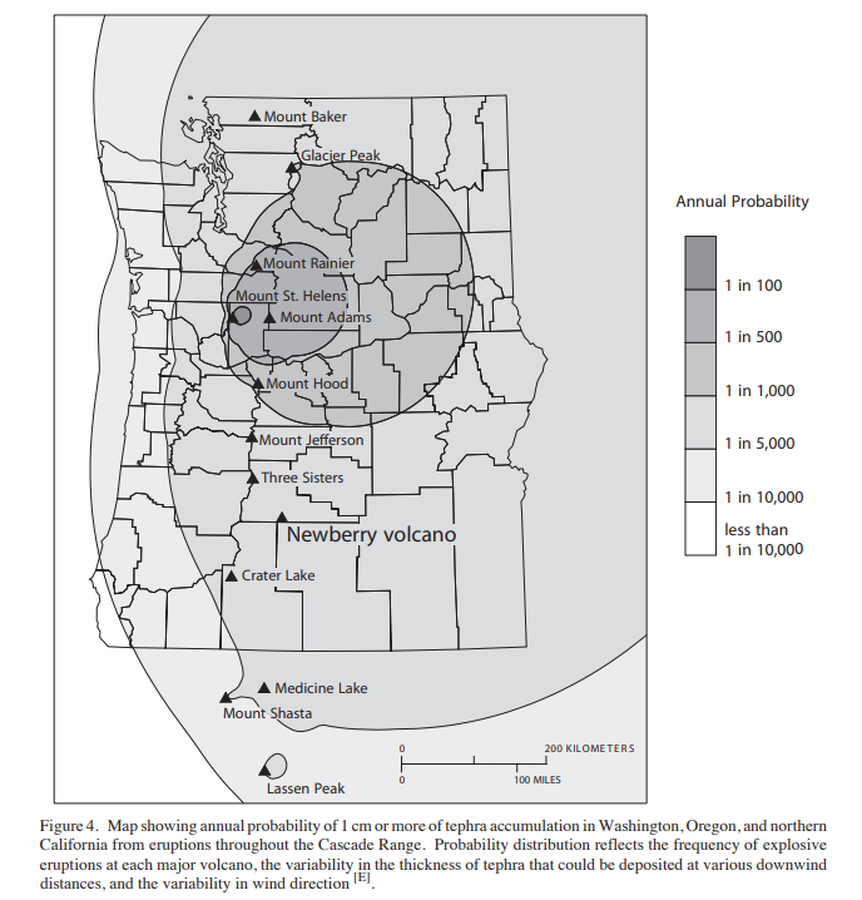
Official, Figure in hazard assessment
Map showing annual probability of 1 cm or more of tephra accumulation in Washington, Oregon, and northern California from eruptions throughout the Cascade Range.
Figure 4 in: Sherrod, D.R., Mastin, L.G., Scott, W.E. & Schilling, S.P. (1997). Volcano hazards at Newberry Volcano, Oregon. U.S. Geological Survey, Open-File Report 97-513, 14 p. https://doi.org/10.3133/ofr97513
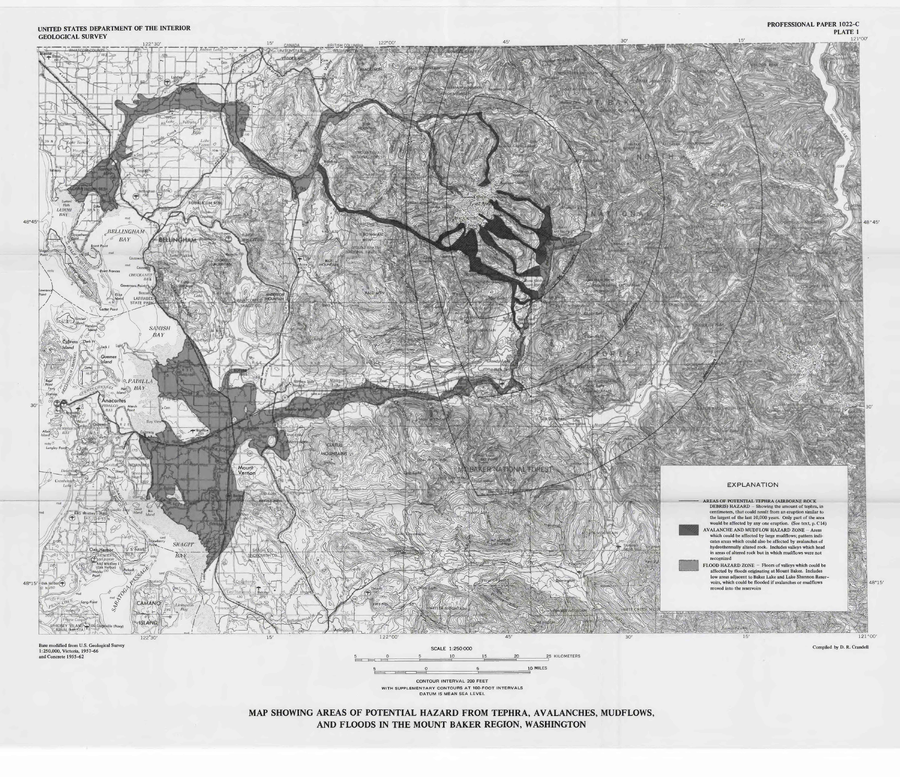
Official, Insert/poster-size map with accompanying report
Map Showing Areas of Potential Hazard from Tephra, Avalanches, Mudflows, and Floods in the Mount Baker Region, Washington
Plate 1 in: Hyde, J. & Crandell, D.R. (1978). Postglacial volcanic deposits at Mount Baker, Washington, and potential hazards from future eruptions. U.S. Geological Survey, Professional Paper 1022-C, C1-C17, 1 plate in pocket. https://doi.org/10.3133/pp1022C